Прямоугольник
сформирован 26.03 в 09:15:25 (UTC+0)
сила сигнала 1 из 5

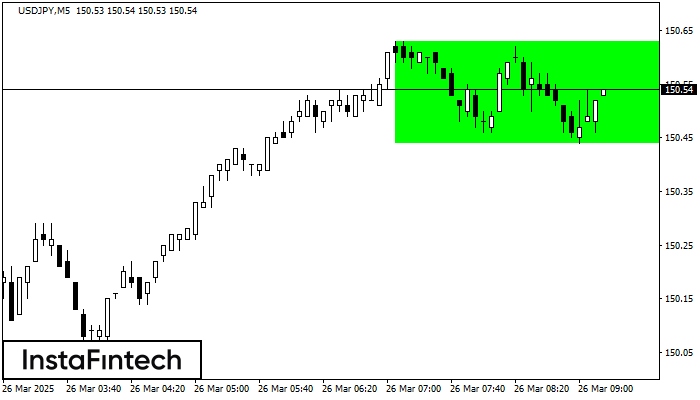
Сформирована фигура «Прямоугольник» на графике USDJPY M5. Тип фигуры: Продолжение тренда; Границы: Верхняя 150.63, Нижняя 150.44; Сигнал: позицию на покупку следует открывать выше верхней границы прямоугольника 150.63.
Таймфреймы М5 и М15 могут иметь больше ложных точек входа.
Shuningdek ko'ring
- Все
- Все
- Bearish Rectangle
- Bearish Symmetrical Triangle
- Bullish Rectangle
- Double Top
- Double Top
- Triple Bottom
- Triple Bottom
- Triple Top
- Triple Top
- Все
- Все
- Покупка
- Продажа
- Все
- 1
- 2
- 3
- 4
- 5
Head and Shoulders
сформирован 02.04 в 09:15:29 (UTC+0)
сила сигнала 1 из 5
The NZDJPY M5 formed the Head and Shoulders pattern with the following features: The Head’s top is at 85.95, the Neckline and the upward angle are at 85.69/85.68. The formation
The M5 and M15 time frames may have more false entry points.
Открыть график инструмента в новом окне
Bearish Symmetrical Triangle
сформирован 02.04 в 09:13:40 (UTC+0)
сила сигнала 4 из 5
According to the chart of H1, USDJPY formed the Bearish Symmetrical Triangle pattern. Trading recommendations: A breach of the lower border 148.72 is likely to encourage a continuation
Открыть график инструмента в новом окне
Double Top
сформирован 02.04 в 09:00:10 (UTC+0)
сила сигнала 3 из 5
On the chart of GBPJPY M30 the Double Top reversal pattern has been formed. Characteristics: the upper boundary 193.71; the lower boundary 193.43; the width of the pattern 28 points
Открыть график инструмента в новом окне