

Dolzarb patternlar

Бычий вымпел
сформирован 24.03 в 21:00:18 (UTC+0)
сила сигнала 3 из 5
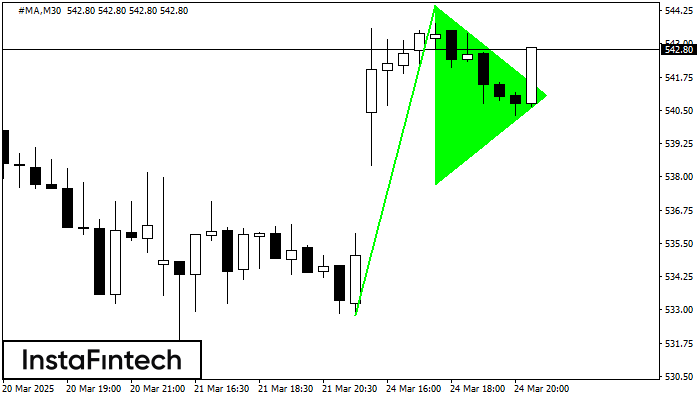
На графике #MA M30 сформировался паттерн «Бычий вымпел», который относится к фигуре продолжения тренда. Можно предполагать, что, в случае фиксации цены выше максимума вымпела 544.44, возможно дальнейшее восходящее движение.
Shuningdek ko'ring
- Все
- Все
- Bearish Rectangle
- Bearish Symmetrical Triangle
- Bearish Symmetrical Triangle
- Bullish Rectangle
- Double Top
- Double Top
- Triple Bottom
- Triple Bottom
- Triple Top
- Triple Top
- Все
- Все
- Покупка
- Продажа
- Все
- 1
- 2
- 3
- 4
- 5
Bearish pennant
was formed on 31.03 at 16:00:21 (UTC+0)
signal strength 1 of 5

The Bearish pennant pattern has formed on the #AMZN M5 chart. It signals potential continuation of the existing trend. Specifications: the pattern’s bottom has the coordinate of 184.25; the projection
The M5 and M15 time frames may have more false entry points.
Open chart in a new window
Double Top
was formed on 31.03 at 16:00:13 (UTC+0)
signal strength 3 of 5
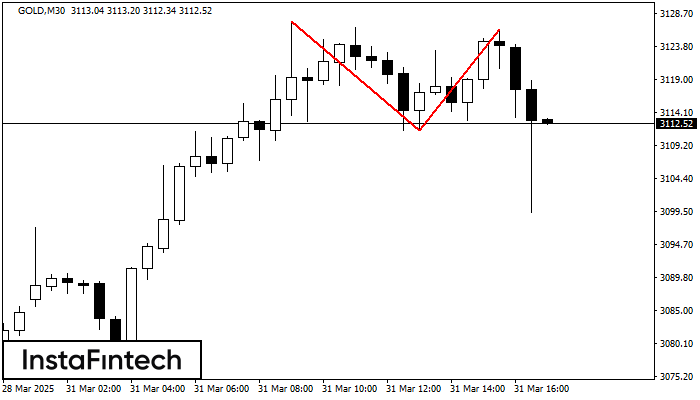
The Double Top reversal pattern has been formed on GOLD M30. Characteristics: the upper boundary 3127.49; the lower boundary 3111.43; the width of the pattern is 1491 points. Sell trades
Open chart in a new window
Double Bottom
was formed on 31.03 at 15:30:34 (UTC+0)
signal strength 1 of 5
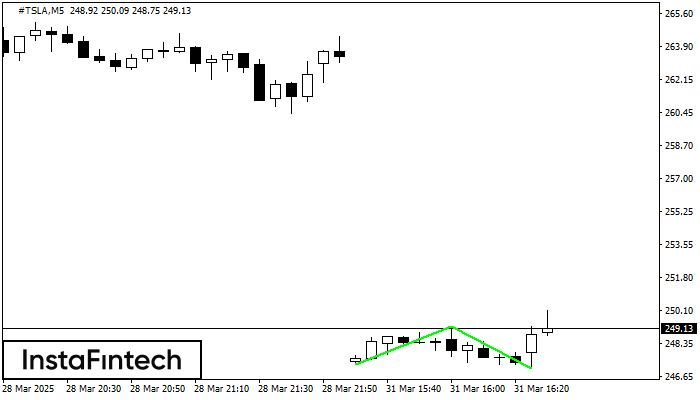
The Double Bottom pattern has been formed on #TSLA M5. This formation signals a reversal of the trend from downwards to upwards. The signal is that a buy trade should
The M5 and M15 time frames may have more false entry points.
Open chart in a new window


