

Dolzarb patternlar

Тройное дно
сформирован 24.03 в 18:09:58 (UTC+0)
сила сигнала 1 из 5
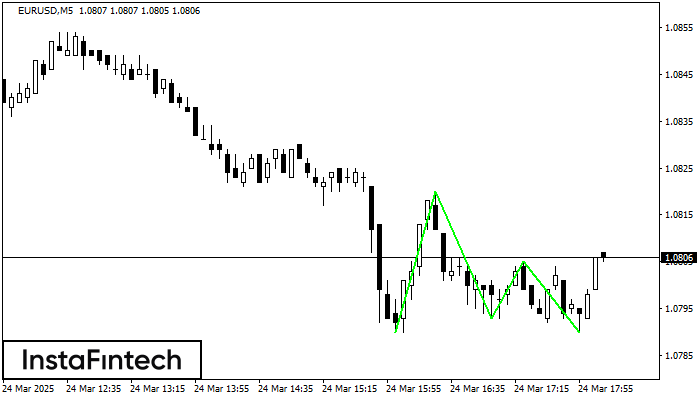
Сформирована фигура «Тройное дно» по торговому инструменту EURUSD на M5. Фигура сигнализирует об изменении тенденции с нисходящей на восходящую в случае пробоя верхней границы 1.0805.
Таймфреймы М5 и М15 могут иметь больше ложных точек входа.
Shuningdek ko'ring
- Все
- Все
- Bearish Rectangle
- Bearish Symmetrical Triangle
- Bearish Symmetrical Triangle
- Bullish Rectangle
- Double Top
- Double Top
- Triple Bottom
- Triple Bottom
- Triple Top
- Triple Top
- Все
- Все
- Покупка
- Продажа
- Все
- 1
- 2
- 3
- 4
- 5
Bearish Symmetrical Triangle
was formed on 31.03 at 12:11:40 (UTC+0)
signal strength 1 of 5
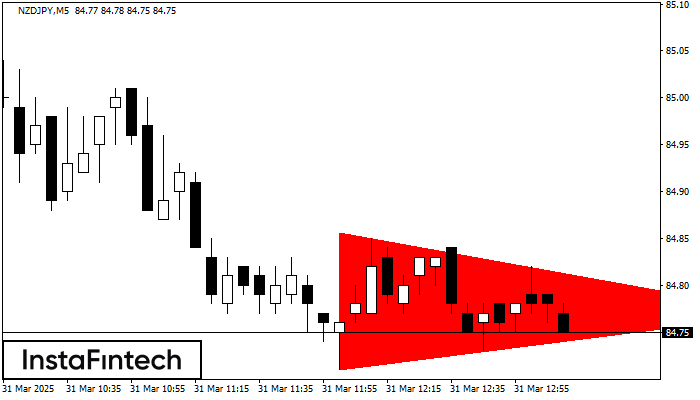
According to the chart of M5, NZDJPY formed the Bearish Symmetrical Triangle pattern. Trading recommendations: A breach of the lower border 84.71 is likely to encourage a continuation
The M5 and M15 time frames may have more false entry points.
Open chart in a new window
Double Bottom
was formed on 31.03 at 11:30:40 (UTC+0)
signal strength 1 of 5
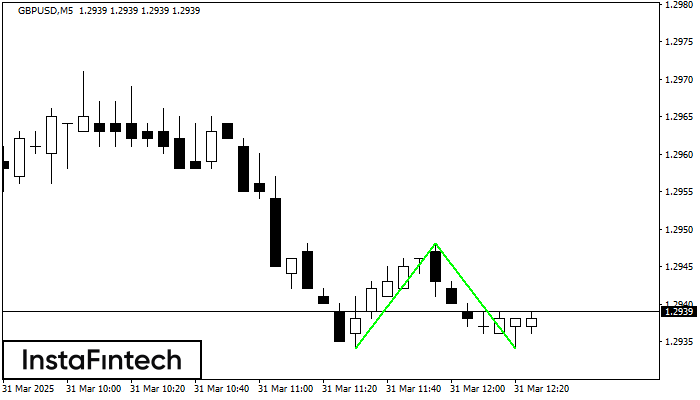
The Double Bottom pattern has been formed on GBPUSD M5; the upper boundary is 1.2948; the lower boundary is 1.2934. The width of the pattern is 14 points. In case
The M5 and M15 time frames may have more false entry points.
Open chart in a new window
Double Bottom
was formed on 31.03 at 11:30:28 (UTC+0)
signal strength 2 of 5
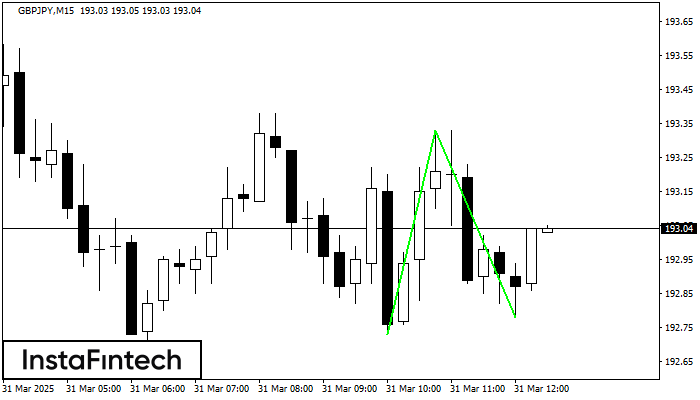
The Double Bottom pattern has been formed on GBPJPY M15; the upper boundary is 193.33; the lower boundary is 192.78. The width of the pattern is 60 points. In case
The M5 and M15 time frames may have more false entry points.
Open chart in a new window


