

Dolzarb patternlar

Бычий симметричный треугольник
сформирован 21.03 в 22:40:31 (UTC+0)
сила сигнала 1 из 5

По AUDUSD на M5 фигура «Бычий симметричный треугольник». Характеристика: Фигура продолжения тренда; Координаты границ – верхняя 0.6279, нижняя 0.6267. Проекция ширины фигуры 12 пунктов. Прогноз: В случае пробоя верхней границы 0.6279 цена, вероятнее всего, продолжит движение к 0.6288.
Таймфреймы М5 и М15 могут иметь больше ложных точек входа.
- Все
- Все
- Bearish Rectangle
- Bearish Symmetrical Triangle
- Bearish Symmetrical Triangle
- Bullish Rectangle
- Double Top
- Double Top
- Triple Bottom
- Triple Bottom
- Triple Top
- Triple Top
- Все
- Все
- Покупка
- Продажа
- Все
- 1
- 2
- 3
- 4
- 5
Bearish Rectangle
was formed on 27.03 at 07:21:11 (UTC+0)
signal strength 1 of 5
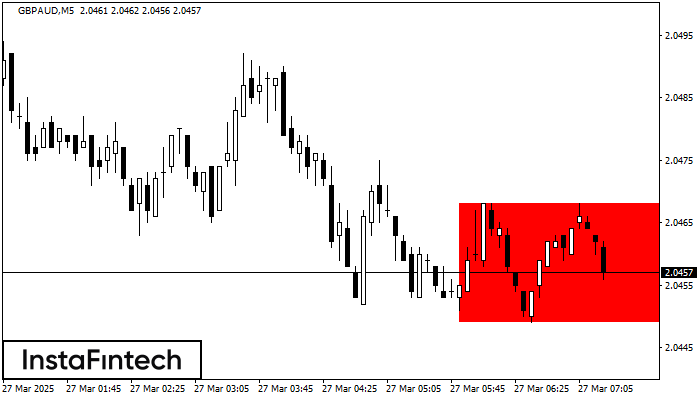
According to the chart of M5, GBPAUD formed the Bearish Rectangle. This type of a pattern indicates a trend continuation. It consists of two levels: resistance 2.0468 - 0.0000
The M5 and M15 time frames may have more false entry points.
Open chart in a new window
Triple Bottom
was formed on 27.03 at 06:40:25 (UTC+0)
signal strength 1 of 5

The Triple Bottom pattern has formed on the chart of USDJPY M5. Features of the pattern: The lower line of the pattern has coordinates 150.29 with the upper limit 150.29/150.27
The M5 and M15 time frames may have more false entry points.
Open chart in a new window
Inverse Head and Shoulder
was formed on 27.03 at 06:15:12 (UTC+0)
signal strength 2 of 5
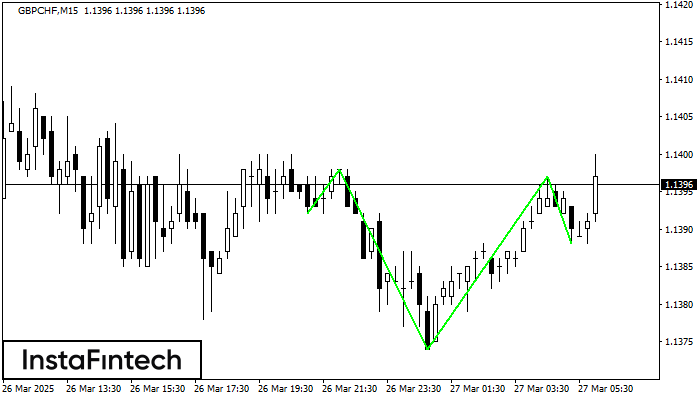
According to M15, GBPCHF is shaping the technical pattern – the Inverse Head and Shoulder. In case the Neckline 1.1398/1.1397 is broken out, the instrument is likely to move toward
The M5 and M15 time frames may have more false entry points.
Open chart in a new window


