

Актуальні патерни

Патерни - це графічні моделі, які "малюють" ціни на графіку. Один з постулатів технічного аналізу говорить нам про те, що історія (рух ціни) завжди повторюється. Це означає, що в схожих ситуаціях рух ціни, найчастіше, буде схожим, що дозволяє з високою часткою ймовірності спрогнозувати подальший розвиток ситуації.
Актуальні патерни від ІнстаФорекс - це зручний сервіс, який дозволить вам завжди бути в курсі останніх змін на ринку і вчасно реагувати на підказки, що з'явилися, від ринку. У нашому сервісі ви завжди знайдете найсвіжіші і актуальніші патерни на будь-якій парі і на будь-якому таймфреймі.
Бычий вымпел
сформирован 01.04 в 18:32:14 (UTC+0)
сила сигнала 4 из 5
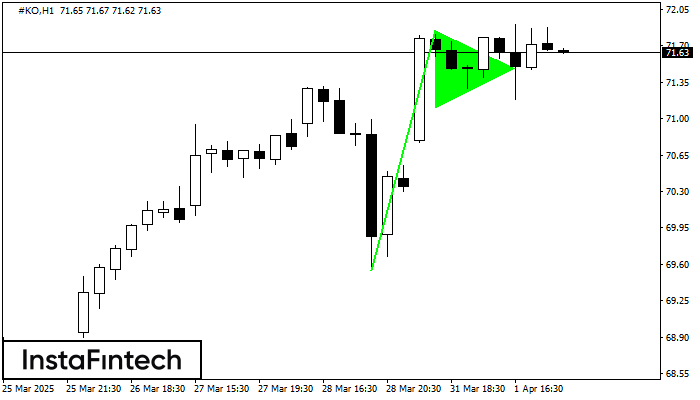
Графическая фигура «Бычий вымпел» сформировалась по инструменту #KO на H1. Данный вид фигуры относится к типу продолжения тенденции. В случае если котировке удастся преодолеть максимум вымпела 71.85, то ожидается продолжение восходящего тренда к уровню 72.25.
Дивіться також
- Все
- Все
- Bearish Rectangle
- Bearish Symmetrical Triangle
- Bearish Symmetrical Triangle
- Bullish Rectangle
- Double Top
- Double Top
- Triple Bottom
- Triple Bottom
- Triple Top
- Triple Top
- Все
- Все
- Покупка
- Продажа
- Все
- 1
- 2
- 3
- 4
- 5
Double Bottom
was formed on 17.04 at 08:15:01 (UTC+0)
signal strength 1 of 5
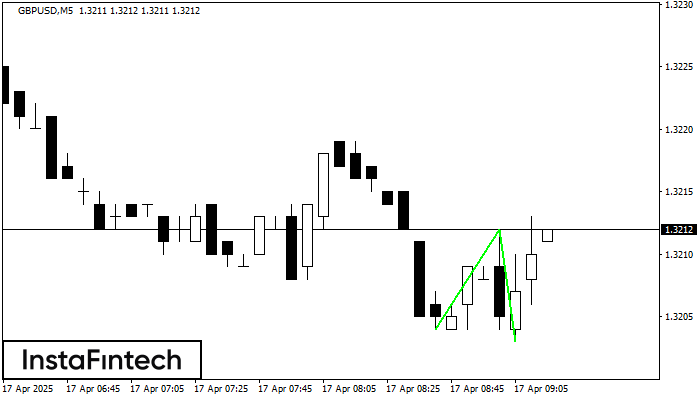
The Double Bottom pattern has been formed on GBPUSD M5; the upper boundary is 1.3212; the lower boundary is 1.3203. The width of the pattern is 8 points. In case
The M5 and M15 time frames may have more false entry points.
Open chart in a new window
Double Top
was formed on 17.04 at 06:00:30 (UTC+0)
signal strength 3 of 5

On the chart of EURJPY M30 the Double Top reversal pattern has been formed. Characteristics: the upper boundary 162.23; the lower boundary 161.48; the width of the pattern 75 points
Open chart in a new window
Double Bottom
was formed on 17.04 at 05:55:25 (UTC+0)
signal strength 1 of 5

The Double Bottom pattern has been formed on AUDUSD M5. Characteristics: the support level 0.6353; the resistance level 0.6366; the width of the pattern 13 points. If the resistance level
The M5 and M15 time frames may have more false entry points.
Open chart in a new window


