

Актуальні патерни

Патерни - це графічні моделі, які "малюють" ціни на графіку. Один з постулатів технічного аналізу говорить нам про те, що історія (рух ціни) завжди повторюється. Це означає, що в схожих ситуаціях рух ціни, найчастіше, буде схожим, що дозволяє з високою часткою ймовірності спрогнозувати подальший розвиток ситуації.
Актуальні патерни від ІнстаФорекс - це зручний сервіс, який дозволить вам завжди бути в курсі останніх змін на ринку і вчасно реагувати на підказки, що з'явилися, від ринку. У нашому сервісі ви завжди знайдете найсвіжіші і актуальніші патерни на будь-якій парі і на будь-якому таймфреймі.
Прямоугольник
сформирован 27.03 в 06:07:54 (UTC+0)
сила сигнала 1 из 5

Сформирована фигура «Прямоугольник» на графике USDJPY M5. Тип фигуры: Продолжение тренда; Границы: Верхняя 150.29, Нижняя 150.10; Сигнал: позиция на продажу открывается после фиксации цены ниже границы прямоугольника 150.10.
Таймфреймы М5 и М15 могут иметь больше ложных точек входа.
- Все
- Все
- Bearish Rectangle
- Bearish Symmetrical Triangle
- Bearish Symmetrical Triangle
- Bullish Rectangle
- Double Top
- Double Top
- Triple Bottom
- Triple Bottom
- Triple Top
- Triple Top
- Все
- Все
- Покупка
- Продажа
- Все
- 1
- 2
- 3
- 4
- 5
Double Top
сформирован 09.04 в 17:34:43 (UTC+0)
сила сигнала 1 из 5
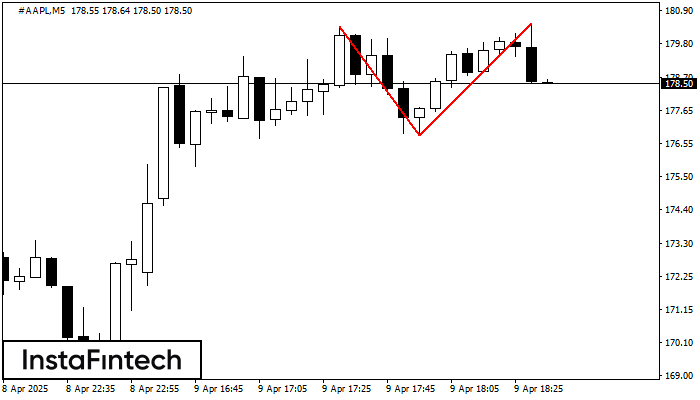
The Double Top pattern has been formed on #AAPL M5. It signals that the trend has been changed from upwards to downwards. Probably, if the base of the pattern 176.83
The M5 and M15 time frames may have more false entry points.
Открыть график инструмента в новом окне
Double Bottom
сформирован 09.04 в 17:29:37 (UTC+0)
сила сигнала 2 из 5
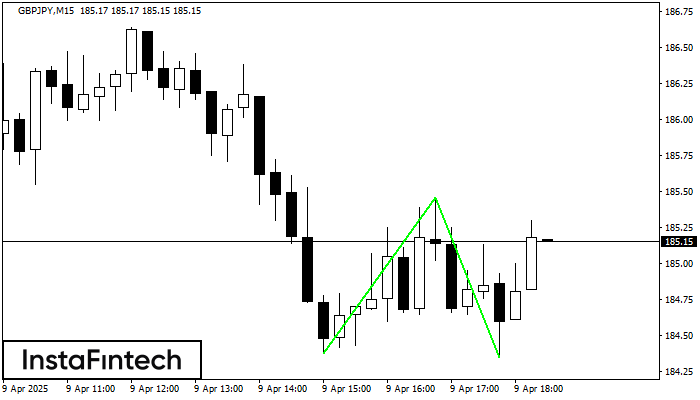
The Double Bottom pattern has been formed on GBPJPY M15; the upper boundary is 185.46; the lower boundary is 184.35. The width of the pattern is 108 points. In case
The M5 and M15 time frames may have more false entry points.
Открыть график инструмента в новом окне
Double Bottom
сформирован 09.04 в 17:19:56 (UTC+0)
сила сигнала 1 из 5
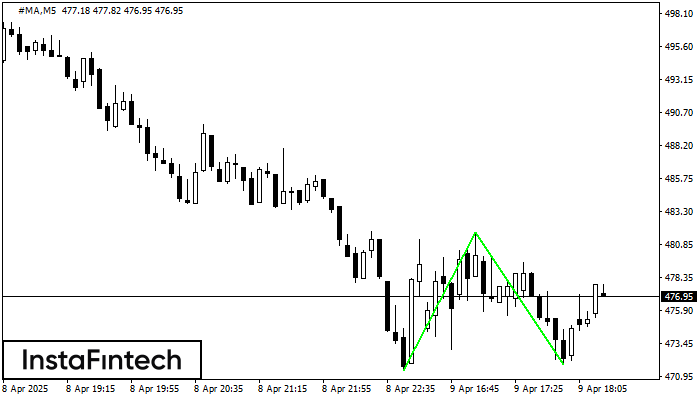
The Double Bottom pattern has been formed on #MA M5. Characteristics: the support level 471.47; the resistance level 481.71; the width of the pattern 1024 points. If the resistance level
The M5 and M15 time frames may have more false entry points.
Открыть график инструмента в новом окне


