

รูปแบบกราฟ

รูปแบบกราฟนั้นเป็น รูปจำลองทางกราฟฟิกที่ถูกสร้างขึ้นมาในชาร์ตจากราคา อ้างอิงตามหนึ่งในการวิเคราะห์ทางเทคนิค ที่ตั้งสมมติฐานมาว่า ประวัติศาสตร์ (การเคลื่อนไหวของราคา) มักจะเกิดขึ้นซ้ำรอยเดิม นั้นหมายความว่า การเคลื่อนไหวของราคาก็หมือนกับ สถานการณ์หนึ่งที่จะสามารถทำการคาดการณ์ไปยังทิศทางในอนาคต ตามเหตุการณ์ที่น่าจะมีความเป็นไปได้สูง
รูปแบบกราฟที่สำคัญจากทาง InstaTrade นั้นจะเป็นการบริการที่มีการใช้อย่างง่ายดาย ซึ่งจะช่วยให้คุณสามารถทราบถึงการเปลี่ยนแปลงล่าสุด ในตลาดได้ และสามารถรับมือกับข้อมูลจากทางตลาดได้ทันท่วงที ในการบริการของพวกเรานั้น คุณจะพบกับรูปแบบกราฟล่าสุดและมีความสำคัญมากที่สุดในทุกๆคู่สกุลเงิน และทุกๆขอบเขตเวลา
Triple Top
was formed on 02.04 at 16:00:28 (UTC+0)
signal strength 2 of 5
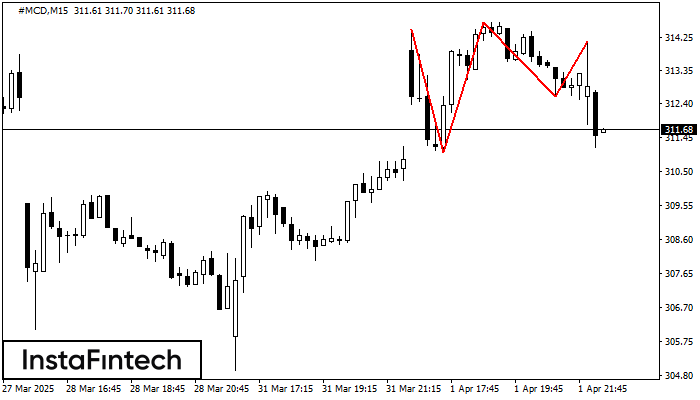
The Triple Top pattern has formed on the chart of the #MCD M15. Features of the pattern: borders have an ascending angle; the lower line of the pattern has the coordinates 311.03/312.60 with the upper limit 314.48/314.14; the projection of the width is 345 points. The formation of the Triple Top figure most likely indicates a change in the trend from upward to downward. This means that in the event of a breakdown of the support level of 311.03, the price is most likely to continue the downward movement.
The M5 and M15 time frames may have more false entry points.
- All
- All
- Bearish Rectangle
- Bearish Symmetrical Triangle
- Bearish Symmetrical Triangle
- Bullish Rectangle
- Double Top
- Double Top
- Triple Bottom
- Triple Bottom
- Triple Top
- Triple Top
- All
- All
- Buy
- Sale
- All
- 1
- 2
- 3
- 4
- 5
รูปแบบกราฟจุดสองยอดขาลง (Double Bottom)
was formed on 05.05 at 23:30:42 (UTC+0)
signal strength 2 of 5
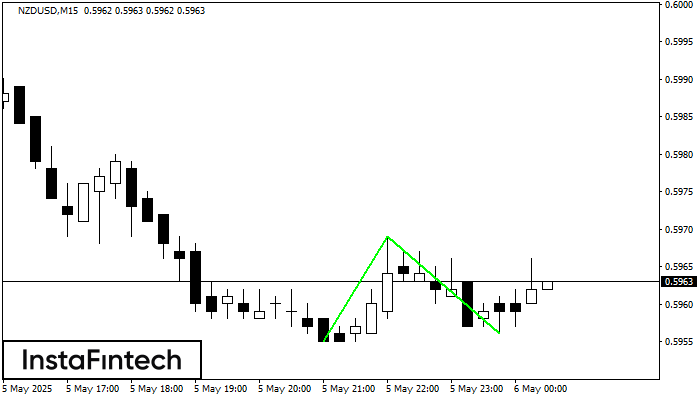
รูปแบบ รูปแบบกราฟจุดสองยอดขาลง (Double Bottom) ถูกสร้างขึ้นมาใน NZDUSD M15 คุณลักษณะ: ระดับของแนวรับ 0.5955; ระดับของแนวต้าน 0.5969; ความกว้างของรูปแบบ 14 จุด
ขอบเตระยะเวลาใน M5 และ M15 อาจจะมีตำแหน่งการเข้าใช้งานที่ผิดพลาดมากยิ่งขึ้น
Open chart in a new window
รูปแบบกราฟจุดสองยอด (Double Top)
was formed on 05.05 at 23:00:46 (UTC+0)
signal strength 2 of 5
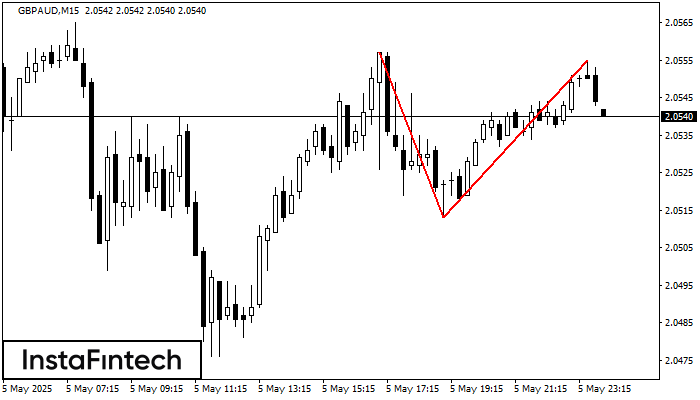
ในชาร์ตของ GBPAUD M15 พบว่า กราฟรูปแบบย้อนกลับ รูปแบบกราฟจุดสองยอด (Double Top) ได้ถูกสร้างขึ้นมา คุณลักษณะ: ขอบเขตด้านบน 2.0555; ขอบเขตด้านล่าง 2.0513; ความกว้างของกราฟรูปแบบนี้คือ
ขอบเตระยะเวลาใน M5 และ M15 อาจจะมีตำแหน่งการเข้าใช้งานที่ผิดพลาดมากยิ่งขึ้น
Open chart in a new window
รูปแบบกราฟจุดสองยอด (Double Top)
was formed on 05.05 at 22:25:24 (UTC+0)
signal strength 1 of 5
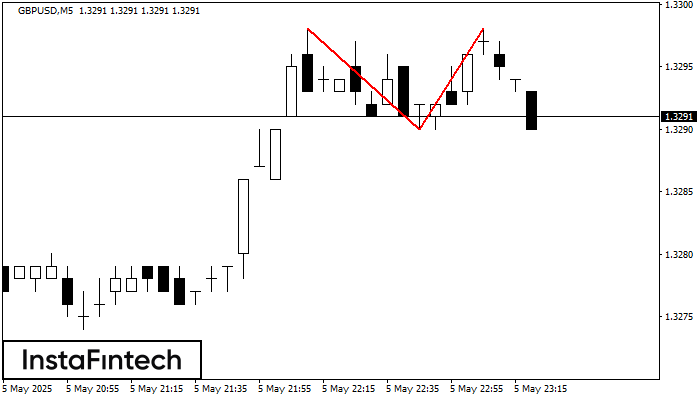
รูปแบบการย้อนตัว รูปแบบกราฟจุดสองยอด (Double Top) ได้ถูกสร้างขึ้นมาใน GBPUSD M5 คุณลักษณะ: ขอบเขตด้านบน 1.3298; ขอบเขตด้านล่าง 1.3290; ความกว้างของกราฟรูปแบบนี้คือ 8 จุด
ขอบเตระยะเวลาใน M5 และ M15 อาจจะมีตำแหน่งการเข้าใช้งานที่ผิดพลาดมากยิ่งขึ้น
Open chart in a new window


