

รูปแบบกราฟ

รูปแบบกราฟนั้นเป็น รูปจำลองทางกราฟฟิกที่ถูกสร้างขึ้นมาในชาร์ตจากราคา อ้างอิงตามหนึ่งในการวิเคราะห์ทางเทคนิค ที่ตั้งสมมติฐานมาว่า ประวัติศาสตร์ (การเคลื่อนไหวของราคา) มักจะเกิดขึ้นซ้ำรอยเดิม นั้นหมายความว่า การเคลื่อนไหวของราคาก็หมือนกับ สถานการณ์หนึ่งที่จะสามารถทำการคาดการณ์ไปยังทิศทางในอนาคต ตามเหตุการณ์ที่น่าจะมีความเป็นไปได้สูง
รูปแบบกราฟที่สำคัญจากทาง InstaTrade นั้นจะเป็นการบริการที่มีการใช้อย่างง่ายดาย ซึ่งจะช่วยให้คุณสามารถทราบถึงการเปลี่ยนแปลงล่าสุด ในตลาดได้ และสามารถรับมือกับข้อมูลจากทางตลาดได้ทันท่วงที ในการบริการของพวกเรานั้น คุณจะพบกับรูปแบบกราฟล่าสุดและมีความสำคัญมากที่สุดในทุกๆคู่สกุลเงิน และทุกๆขอบเขตเวลา
Double Bottom
was formed on 27.03 at 00:00:29 (UTC+0)
signal strength 3 of 5

The Double Bottom pattern has been formed on NZDCAD M30; the upper boundary is 0.8209; the lower boundary is 0.8165. The width of the pattern is 43 points. In case of a break of the upper boundary 0.8209, a change in the trend can be predicted where the width of the pattern will coincide with the distance to a possible take profit level.
- All
- All
- Bearish Rectangle
- Bearish Symmetrical Triangle
- Bearish Symmetrical Triangle
- Bullish Rectangle
- Double Top
- Double Top
- Triple Bottom
- Triple Bottom
- Triple Top
- Triple Top
- All
- All
- Buy
- Sale
- All
- 1
- 2
- 3
- 4
- 5
Double Bottom
was formed on 25.04 at 18:30:14 (UTC+0)
signal strength 1 of 5
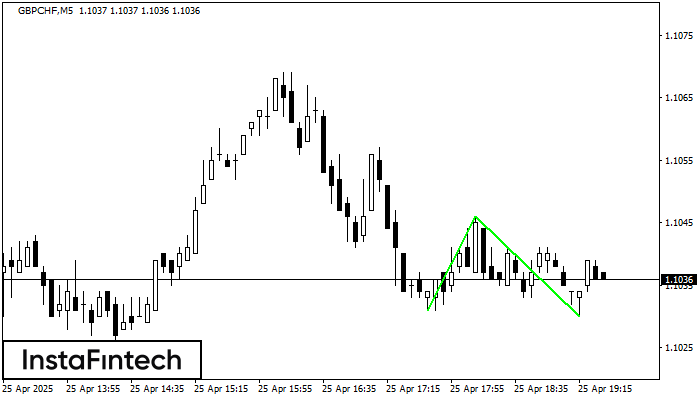
The Double Bottom pattern has been formed on GBPCHF M5. Characteristics: the support level 1.1031; the resistance level 1.1046; the width of the pattern 15 points. If the resistance level
The M5 and M15 time frames may have more false entry points.
Open chart in a new window
Double Bottom
was formed on 25.04 at 18:15:42 (UTC+0)
signal strength 2 of 5
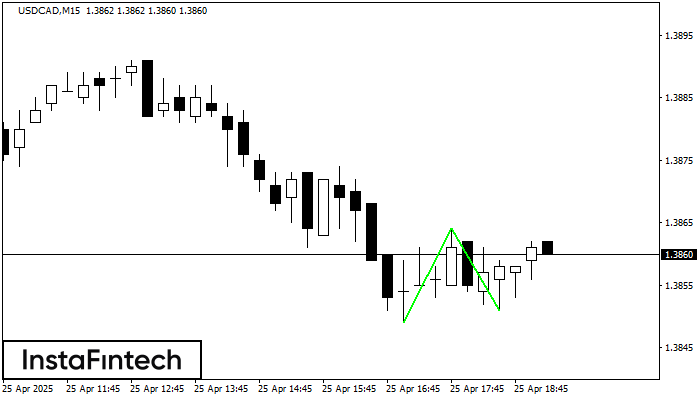
The Double Bottom pattern has been formed on USDCAD M15; the upper boundary is 1.3864; the lower boundary is 1.3851. The width of the pattern is 15 points. In case
The M5 and M15 time frames may have more false entry points.
Open chart in a new window
Triple Bottom
was formed on 25.04 at 17:54:55 (UTC+0)
signal strength 1 of 5
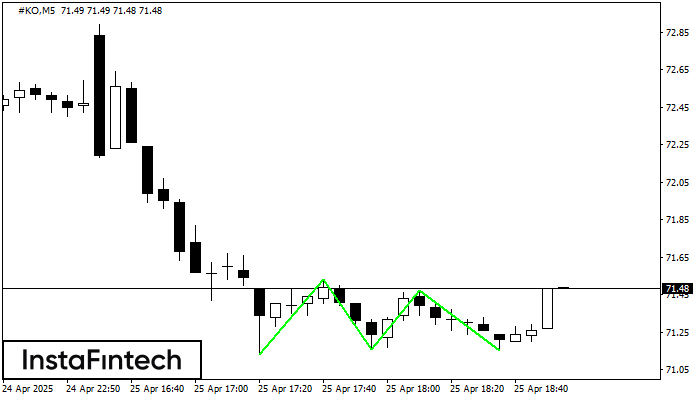
The Triple Bottom pattern has formed on the chart of the #KO M5 trading instrument. The pattern signals a change in the trend from downwards to upwards in the case
The M5 and M15 time frames may have more false entry points.
Open chart in a new window


