

Patrones actuales

Los patrones son modelos gráficos que se forman en el gráfico mediante el precio. Según uno de los postulados del análisis técnico, la historia (movimiento del precio) se repite. Esto quiere decir que los movimientos del precio a menudo son similares en las mismas situaciones que hacen posible pronosticar el futuro desarrollo de la situación con una alta probabilidad.
Los patrones relevantes de InstaTrade son un servicio fácil de utilizar que permiten que conozca los últimos cambios en el mercado y reaccione a las pistas del mercado a tiempo. En nuestro servicio, siempre encontrará los últimos y más importantes patrones en cualquier par y en cualquier marco de tiempo.
Bearish Symmetrical Triangle
was formed on 01.04 at 09:18:41 (UTC+0)
signal strength 4 of 5

According to the chart of H1, NZDJPY formed the Bearish Symmetrical Triangle pattern. Description: The lower border is 84.61/84.93 and upper border is 85.30/84.93. The pattern width is measured on the chart at -69 pips. The formation of the Bearish Symmetrical Triangle pattern evidently signals a continuation of the downward trend. In other words, if the scenario comes true and NZDJPY breaches the lower border, the price could continue its move toward 84.53.
Vea asimismo
- All
- All
- Bearish Rectangle
- Bearish Symmetrical Triangle
- Bearish Symmetrical Triangle
- Bullish Rectangle
- Double Top
- Double Top
- Triple Bottom
- Triple Bottom
- Triple Top
- Triple Top
- All
- All
- Buy
- Sale
- All
- 1
- 2
- 3
- 4
- 5
Bearish Symmetrical Triangle
was formed on 08.04 at 23:35:37 (UTC+0)
signal strength 1 of 5
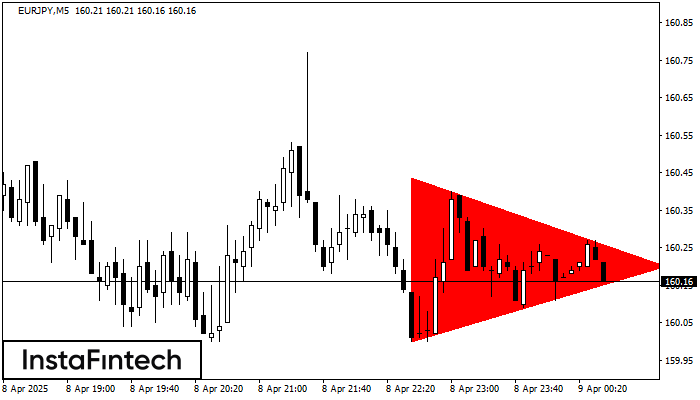
According to the chart of M5, EURJPY formed the Bearish Symmetrical Triangle pattern. This pattern signals a further downward trend in case the lower border 160.00 is breached. Here
The M5 and M15 time frames may have more false entry points.
Open chart in a new window
Double Bottom
was formed on 08.04 at 23:00:01 (UTC+0)
signal strength 1 of 5
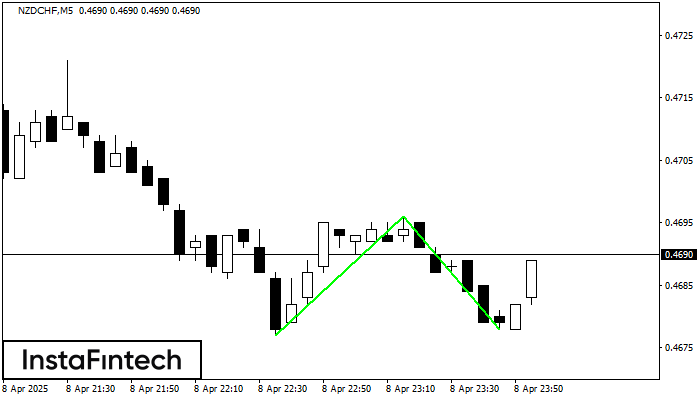
The Double Bottom pattern has been formed on NZDCHF M5; the upper boundary is 0.4696; the lower boundary is 0.4678. The width of the pattern is 19 points. In case
The M5 and M15 time frames may have more false entry points.
Open chart in a new window
Triple Bottom
was formed on 08.04 at 22:55:22 (UTC+0)
signal strength 1 of 5
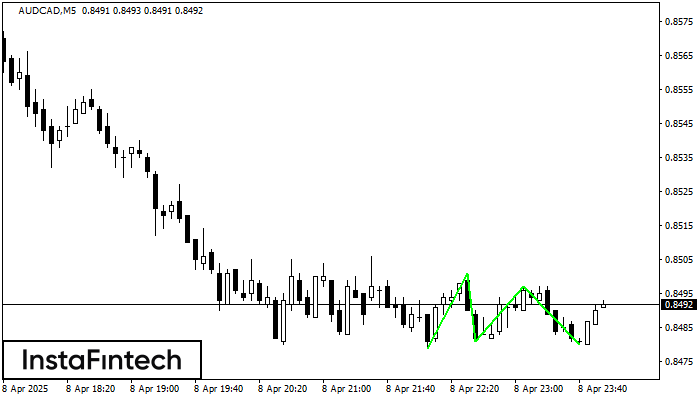
The Triple Bottom pattern has formed on the chart of AUDCAD M5. Features of the pattern: The lower line of the pattern has coordinates 0.8501 with the upper limit 0.8501/0.8497
The M5 and M15 time frames may have more false entry points.
Open chart in a new window


