

Patrones actuales

Los patrones son modelos gráficos que se forman en el gráfico mediante el precio. Según uno de los postulados del análisis técnico, la historia (movimiento del precio) se repite. Esto quiere decir que los movimientos del precio a menudo son similares en las mismas situaciones que hacen posible pronosticar el futuro desarrollo de la situación con una alta probabilidad.
Los patrones relevantes de InstaTrade son un servicio fácil de utilizar que permiten que conozca los últimos cambios en el mercado y reaccione a las pistas del mercado a tiempo. En nuestro servicio, siempre encontrará los últimos y más importantes patrones en cualquier par y en cualquier marco de tiempo.
Double Bottom
was formed on 24.03 at 19:06:44 (UTC+0)
signal strength 1 of 5
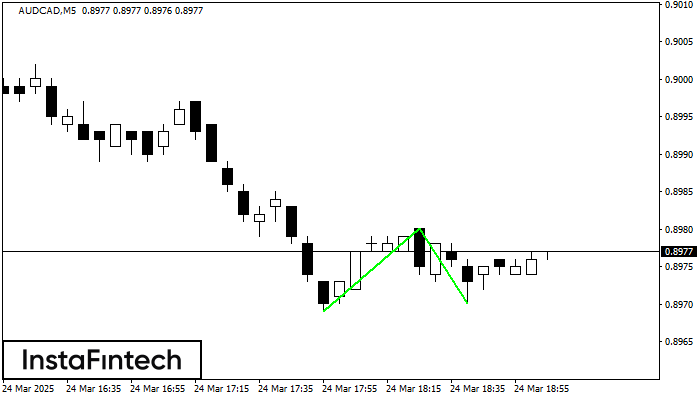
The Double Bottom pattern has been formed on AUDCAD M5; the upper boundary is 0.8980; the lower boundary is 0.8970. The width of the pattern is 11 points. In case of a break of the upper boundary 0.8980, a change in the trend can be predicted where the width of the pattern will coincide with the distance to a possible take profit level.
The M5 and M15 time frames may have more false entry points.
Vea asimismo
- All
- All
- Bearish Rectangle
- Bearish Symmetrical Triangle
- Bearish Symmetrical Triangle
- Bullish Rectangle
- Double Top
- Double Top
- Triple Bottom
- Triple Bottom
- Triple Top
- Triple Top
- All
- All
- Buy
- Sale
- All
- 1
- 2
- 3
- 4
- 5
Triple Top
was formed on 31.03 at 08:30:26 (UTC+0)
signal strength 3 of 5

The Triple Top pattern has formed on the chart of the EURCAD M30. Features of the pattern: borders have an ascending angle; the lower line of the pattern
Open chart in a new window
Head and Shoulders
was formed on 31.03 at 08:30:17 (UTC+0)
signal strength 3 of 5

The technical pattern called Head and Shoulders has appeared on the chart of EURGBP M30. There are weighty reasons to suggest that the price will surpass the Neckline 0.8358/0.8357 after
Open chart in a new window
Head and Shoulders
was formed on 31.03 at 08:30:15 (UTC+0)
signal strength 2 of 5
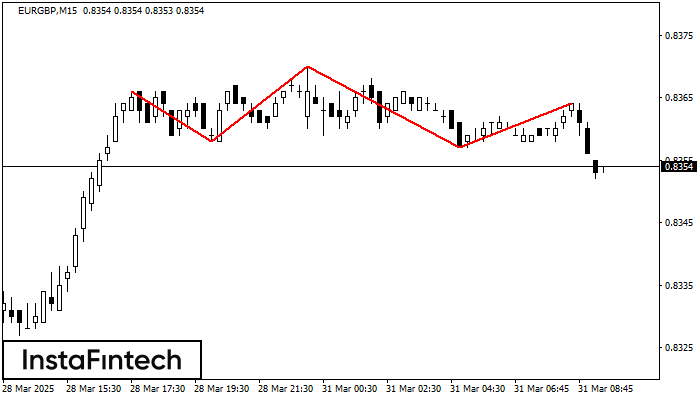
According to the chart of M15, EURGBP formed the Head and Shoulders pattern. The Head’s top is set at 0.8370 while the median line of the Neck is found
The M5 and M15 time frames may have more false entry points.
Open chart in a new window


