Актуальные паттерны

Паттерны – это графические модели, которые "рисует" цена на графике. Один из постулатов технического анализа говорит нам о том, что история (движение цены) всегда повторяется. Это значит, что в похожих ситуациях движение цены, зачастую, будет похожим, что позволяет с высокой долей вероятности спрогнозировать дальнейшее развитие ситуации.
Актуальные паттерны от ИнстаФорекс – это удобный сервис, который позволит вам всегда быть в курсе последних изменений на рынке и вовремя реагировать на появившиеся подсказки от рынка. В нашем сервисе вы всегда найдете самые свежие и актуальные паттерны на любой паре и на любом таймфрейме.
Двойное дно
сформирован 14.04 в 14:45:10 (UTC+0)
сила сигнала 1 из 5
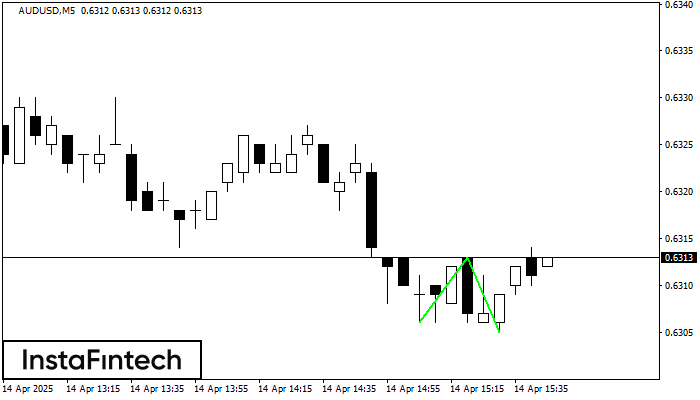
Сформирована фигура «Двойное дно» на графике AUDUSD M5. Верхняя граница 0.6313; Нижняя граница 0.6305; Ширина фигуры 7 пунктов. В случае пробоя верхней границы 0.6313 можно будет прогнозировать изменение тенденции, где ширина фигуры и будет являться расстоянием предположительного Тейк Профита.
Таймфреймы М5 и М15 могут иметь больше ложных точек входа.
- Все
- Все
- Bearish Rectangle
- Bearish Symmetrical Triangle
- Bearish Symmetrical Triangle
- Bullish Rectangle
- Double Top
- Double Top
- Triple Bottom
- Triple Bottom
- Triple Top
- Triple Top
- Все
- Все
- Покупка
- Продажа
- Все
- 1
- 2
- 3
- 4
- 5
Double Bottom
was formed on 25.04 at 19:40:19 (UTC+0)
signal strength 1 of 5
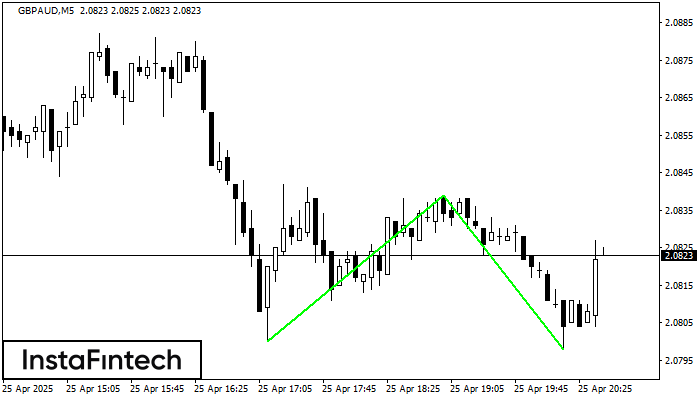
The Double Bottom pattern has been formed on GBPAUD M5. This formation signals a reversal of the trend from downwards to upwards. The signal is that a buy trade should
The M5 and M15 time frames may have more false entry points.
Open chart in a new window
Bearish Rectangle
was formed on 25.04 at 19:38:48 (UTC+0)
signal strength 1 of 5
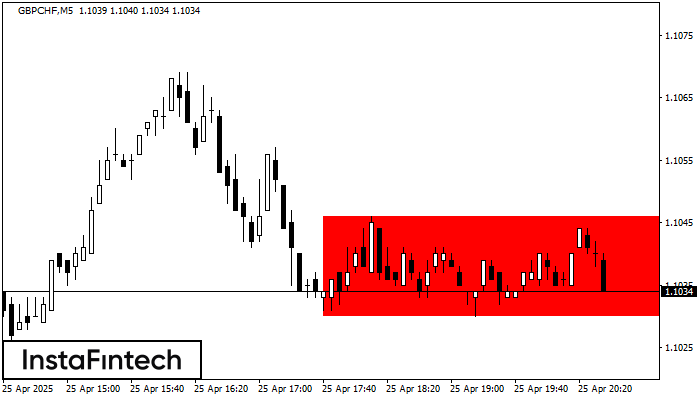
According to the chart of M5, GBPCHF formed the Bearish Rectangle. The pattern indicates a trend continuation. The upper border is 1.1046, the lower border is 1.1030. The signal means
The M5 and M15 time frames may have more false entry points.
Open chart in a new window
Bearish pennant
was formed on 25.04 at 19:29:19 (UTC+0)
signal strength 1 of 5
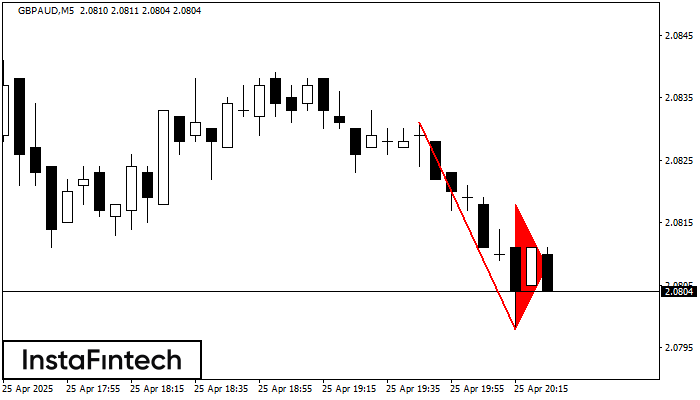
The Bearish pennant pattern has formed on the GBPAUD M5 chart. The pattern signals continuation of the downtrend in case the pennant’s low of 2.0798 is broken through. Recommendations: Place
The M5 and M15 time frames may have more false entry points.
Open chart in a new window