Актуальные паттерны

Паттерны – это графические модели, которые "рисует" цена на графике. Один из постулатов технического анализа говорит нам о том, что история (движение цены) всегда повторяется. Это значит, что в похожих ситуациях движение цены, зачастую, будет похожим, что позволяет с высокой долей вероятности спрогнозировать дальнейшее развитие ситуации.
Актуальные паттерны от ИнстаФорекс – это удобный сервис, который позволит вам всегда быть в курсе последних изменений на рынке и вовремя реагировать на появившиеся подсказки от рынка. В нашем сервисе вы всегда найдете самые свежие и актуальные паттерны на любой паре и на любом таймфрейме.
Тройное дно
сформирован 03.04 в 01:24:55 (UTC+0)
сила сигнала 1 из 5
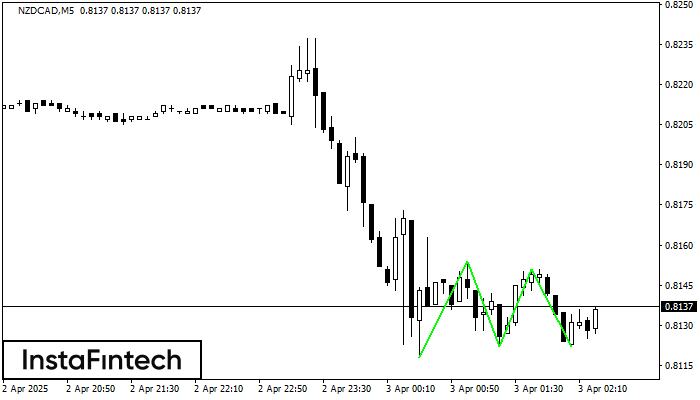
Сформирована фигура «Тройное дно» по торговому инструменту NZDCAD на M5. Фигура сигнализирует об изменении тенденции с нисходящей на восходящую в случае пробоя верхней границы 0.8151.
Таймфреймы М5 и М15 могут иметь больше ложных точек входа.
Смотрите также
- Все
- Все
- Bearish Rectangle
- Bearish Symmetrical Triangle
- Bearish Symmetrical Triangle
- Bullish Rectangle
- Double Top
- Double Top
- Triple Bottom
- Triple Bottom
- Triple Top
- Triple Top
- Все
- Все
- Покупка
- Продажа
- Все
- 1
- 2
- 3
- 4
- 5
Triple Bottom
was formed on 14.04 at 20:56:31 (UTC+0)
signal strength 1 of 5
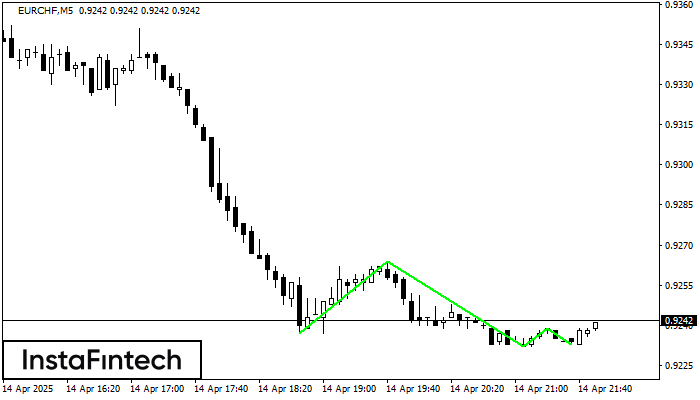
The Triple Bottom pattern has been formed on EURCHF M5. It has the following characteristics: resistance level 0.9264/0.9239; support level 0.9237/0.9233; the width is 27 points. In the event
The M5 and M15 time frames may have more false entry points.
Open chart in a new window
Bearish Flag
was formed on 14.04 at 20:47:04 (UTC+0)
signal strength 3 of 5

The Bearish Flag pattern has been formed on EURJPY at M30. The lower boundary of the pattern is located at 162.05/162.27 while the upper boundary lies at 162.33/162.55. The projection
Open chart in a new window
Bearish pennant
was formed on 14.04 at 20:46:59 (UTC+0)
signal strength 3 of 5

The Bearish pennant pattern has formed on the EURJPY M30 chart. It signals potential continuation of the existing trend. Specifications: the pattern’s bottom has the coordinate of 162.05; the projection
Open chart in a new window