

Актуальные паттерны

Паттерны – это графические модели, которые "рисует" цена на графике. Один из постулатов технического анализа говорит нам о том, что история (движение цены) всегда повторяется. Это значит, что в похожих ситуациях движение цены, зачастую, будет похожим, что позволяет с высокой долей вероятности спрогнозировать дальнейшее развитие ситуации.
Актуальные паттерны от ИнстаФорекс – это удобный сервис, который позволит вам всегда быть в курсе последних изменений на рынке и вовремя реагировать на появившиеся подсказки от рынка. В нашем сервисе вы всегда найдете самые свежие и актуальные паттерны на любой паре и на любом таймфрейме.
Двойная вершина
сформирован 25.03 в 01:00:30 (UTC+0)
сила сигнала 3 из 5
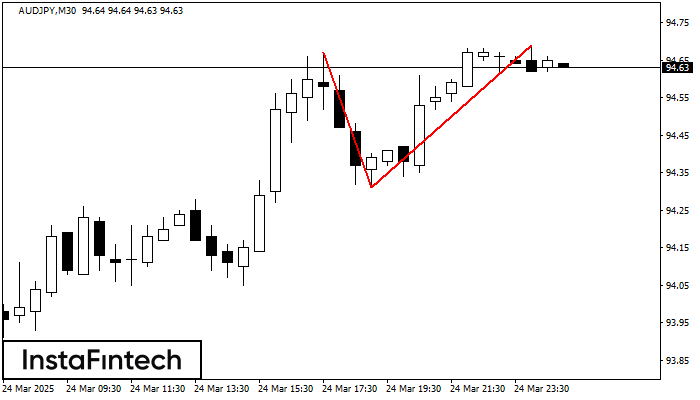
На торговом графике AUDJPY M30 сформировалась разворотная фигура «Двойная вершина». Характеристика: Верхняя граница 94.69; Нижняя граница 94.31; Ширина фигуры 38 пунктов. Сигнал: Пробой нижней границы 94.31 приведет к дальнейшему нисходящему движению с перспективой хода к уровню 94.01.


