

Actual patterns

Patterns are graphical models which are formed in the chart by the price. According to one of the technical analysis postulates, history (price movement) repeats itself. It means that the price movements are often similar in the same situations which makes it possible to predict the further development of the situation with a high probability.
Relevant patterns by InstaTrade is an easy-to-use service which allows you to be aware of latest changes in the market and react to clues from the market in time. In our service you will always find the latest and most relevant patterns on any pair and any timeframe.
Actual Patterns
- All
- All
- Bearish Rectangle
- Bearish Symmetrical Triangle
- Bearish Symmetrical Triangle
- Bullish Rectangle
- Double Top
- Double Top
- Triple Bottom
- Triple Bottom
- Triple Top
- Triple Top
- All
- All
- Buy
- Sale
- All
- 1
- 2
- 3
- 4
- 5
Đáy đôi
was formed on 18.04 at 07:00:33 (UTC+0)
signal strength 1 of 5
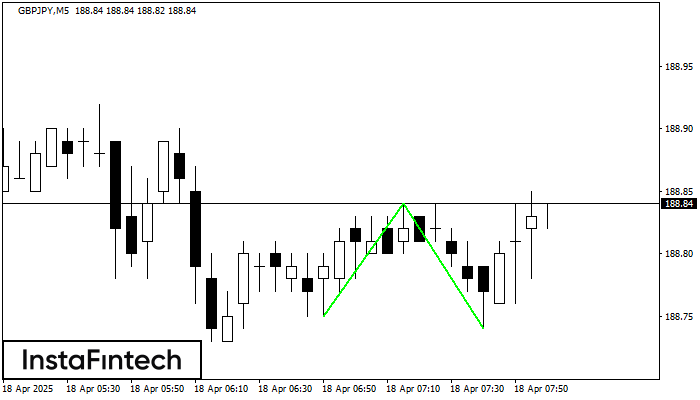
Mô hình Đáy đôi đã được hình thành trên GBPJPY M5; đường viền trên là 188.84; đường viền dưới là 188.74. Độ rộng của mô hình là 9 điểm. Trong
Khung thời gian M5 và M15 có thể có nhiều điểm vào lệnh sai hơn.
Open chart in a new window
Đỉnh đôi
was formed on 18.04 at 04:45:09 (UTC+0)
signal strength 1 of 5
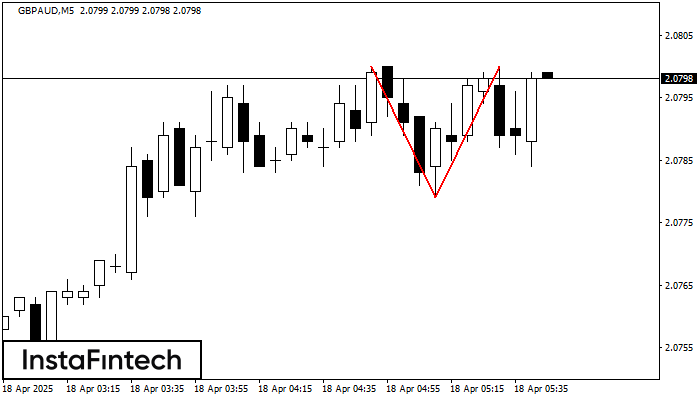
Mô hình đảo chiều Đỉnh đôi đã được hình thành trên GBPAUD M5. Đặc điểm: ranh giới trên 2.0800; ranh giới dưới 2.0779; chiều rộng của mô hình
Khung thời gian M5 và M15 có thể có nhiều điểm vào lệnh sai hơn.
Open chart in a new window
Đỉnh đôi
was formed on 18.04 at 04:10:38 (UTC+0)
signal strength 1 of 5
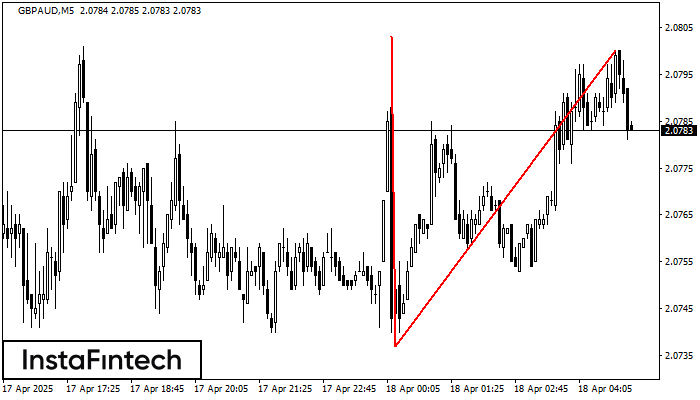
Mô hình đảo chiều Đỉnh đôi đã được hình thành trên GBPAUD M5. Đặc điểm: ranh giới trên 2.0803; ranh giới dưới 2.0737; chiều rộng của mô hình
Khung thời gian M5 và M15 có thể có nhiều điểm vào lệnh sai hơn.
Open chart in a new window


