
ZARJPY (South African Rand vs Japanese Yen). Exchange rate and online charts.
Currency converter
28 Mar 2025 23:59
(0%)
Closing price, the previous day.
Opening price.
The highest price over the last trading day.
The lowest price over the last trading day
Price range high in the last week
Price range low in the last week
ZAR/JPY (South African Rand vs Japanese Yen)
The ZAR/JPY currency pair represents a cross rate against the U.S. dollar which bears upon the further rate of ZAR/JPY. Thus, by merging the USD/JPY and USD/ZAR price charts, it is possible to get a rough ZAR/JPY price chart. However, this instrument is not actively traded on the Forex market.
The U.S. economic indicators such as the interest rate, GDP growth, unemployment rate, new vacancies, and others can serve well when analyzing ZAR/JPY movements as the greenback can influence the currency pair significantly. However, the currencies can respond differently to the changes in the U.S. economy.
South African rand is one of the most tradable currencies in the world. Thanks to the huge mineral deposits, South Africa is the richest country in its region. It is also famous for the stock exchange which is listed among the world's top ten exchanges. South African economy is based mainly on the extraction and export of minerals.
South Africa produces a great number of precious stones and metals, including gold and diamonds. In addition, it is the largest car manufacturer in Africa. South Africa is quite self-sufficient in providing itself with the necessary raw materials for production. The factors that affect the South African rand the most are the prices for the precious stones and metals, and the level of industrial production.
The ZAR/JPY currency pair is very exposed to a variety of world's major political and economic developments. For this reason, the price chart for this currency pair is poorly predictable and often goes in the opposite direction regardless of any analysis.
Beginners are not recommended to start their trading with this currency pair. To successfully project the further course rate of this trading instrument, it is necessary to know many nuances of the price chart behaviour as they can affect the pair's movement.
When compared to EUR/USD, USD/CHF, GBP/USD, and USD/JPY, the ZAR/JPY trading instrument is relatively illiquid. Hence, trying to predict the ZAR/JPY further trend, it is necessary to consider the USD/JPY and USD/JPY price charts.
As a rule, the brokers set a higher spread for cross rates rather than for major currency pairs. That is why before trading crosses, learn carefully the terms and conditions offered by the broker.
See Also
- Technical analysis / Video analytics

Forex forecast 28/03/2025: EUR/USD, GBP/USD, USD/JPY, Oil and Bitcoin
Technical analysis of EUR/USD, GBP/USD, USD/JPY, Oil and BitcoinAuthor: Sebastian Seliga
00:24 2025-03-29 UTC+2
1783
Bulls have been attacking for two weeks, but they've run out of steamAuthor: Samir Klishi
11:48 2025-03-28 UTC+2
1513
The EUR/USD pair rose by 60 basis points over the course of Thursday.Author: Chin Zhao
20:10 2025-03-28 UTC+2
1468
- Technical analysis
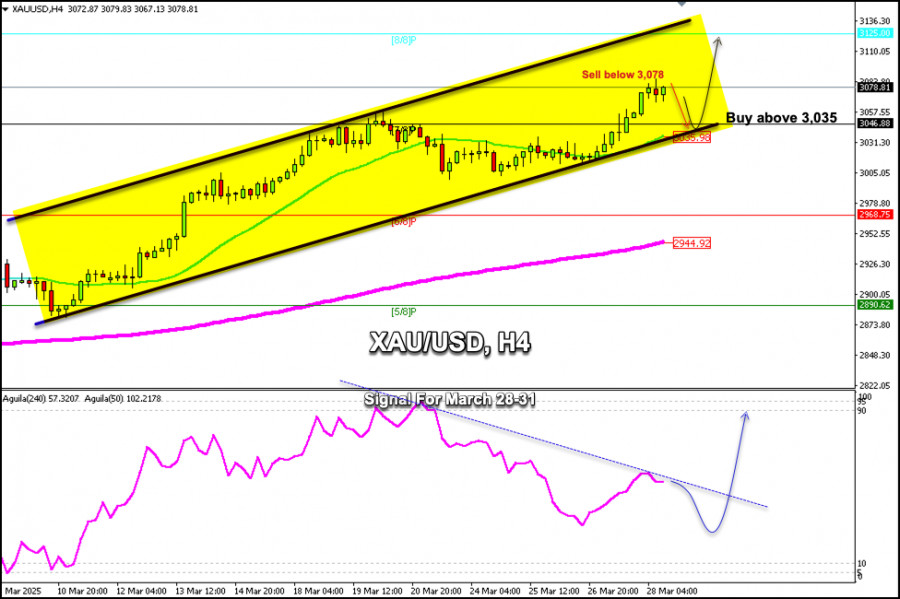
Trading Signals for GOLD (XAU/USD) for March 28-31, 2025: sell below $3,078 (technical correction - 21 SMA)
Important support is located around the 21 SMA at 3,035. This level coincides with the bottom of the uptrend channel, which could suggest a technical rebound in the coming days.Author: Dimitrios Zappas
15:12 2025-03-28 UTC+2
1453
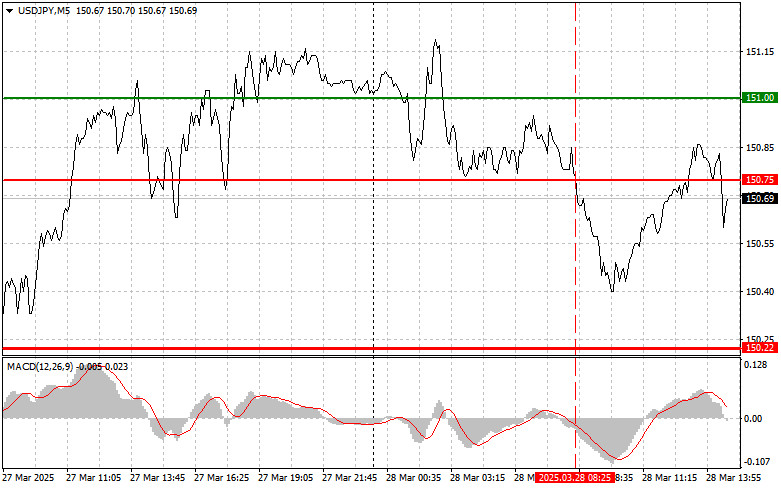
USDJPY: Simple Trading Tips for Beginner Traders on March 28th (U.S. Session)Author: Jakub Novak
20:04 2025-03-28 UTC+2
1273
The GBP/USD pair rose by 70 basis points on Thursday and added a symbolic 10 points on Friday.Author: Chin Zhao
20:07 2025-03-28 UTC+2
1258
- EUR/USD. Analysis and Forecast
Author: Irina Yanina
11:45 2025-03-28 UTC+2
1243
As the week comes to an end, the market remains indecisive, with no clear preferences evident. Yesterday, the bulls made some progress, adjusting the prevailing bearish sentiment. To confirm and consolidate the result, they need to overcome the cluster of resistance levels from various timeframesAuthor: Evangelos Poulakis
10:09 2025-03-28 UTC+2
1228
Bears are trying to break through the bulls' defensesAuthor: Samir Klishi
11:36 2025-03-28 UTC+2
1213

- Technical analysis / Video analytics
Forex forecast 28/03/2025: EUR/USD, GBP/USD, USD/JPY, Oil and Bitcoin
Technical analysis of EUR/USD, GBP/USD, USD/JPY, Oil and BitcoinAuthor: Sebastian Seliga
00:24 2025-03-29 UTC+2
1783
- Bulls have been attacking for two weeks, but they've run out of steam
Author: Samir Klishi
11:48 2025-03-28 UTC+2
1513
- The EUR/USD pair rose by 60 basis points over the course of Thursday.
Author: Chin Zhao
20:10 2025-03-28 UTC+2
1468
- Technical analysis
Trading Signals for GOLD (XAU/USD) for March 28-31, 2025: sell below $3,078 (technical correction - 21 SMA)
Important support is located around the 21 SMA at 3,035. This level coincides with the bottom of the uptrend channel, which could suggest a technical rebound in the coming days.Author: Dimitrios Zappas
15:12 2025-03-28 UTC+2
1453
- USDJPY: Simple Trading Tips for Beginner Traders on March 28th (U.S. Session)
Author: Jakub Novak
20:04 2025-03-28 UTC+2
1273
- The GBP/USD pair rose by 70 basis points on Thursday and added a symbolic 10 points on Friday.
Author: Chin Zhao
20:07 2025-03-28 UTC+2
1258
- EUR/USD. Analysis and Forecast
Author: Irina Yanina
11:45 2025-03-28 UTC+2
1243
- As the week comes to an end, the market remains indecisive, with no clear preferences evident. Yesterday, the bulls made some progress, adjusting the prevailing bearish sentiment. To confirm and consolidate the result, they need to overcome the cluster of resistance levels from various timeframes
Author: Evangelos Poulakis
10:09 2025-03-28 UTC+2
1228
- Bears are trying to break through the bulls' defenses
Author: Samir Klishi
11:36 2025-03-28 UTC+2
1213


