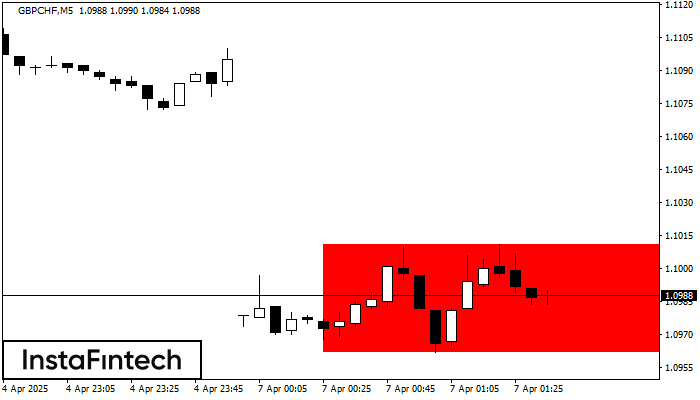
Bearish Rectangle
was formed on 07.04 at 00:36:44 (UTC+0)
signal strength 1 of 5

According to the chart of M5, GBPCHF formed the Bearish Rectangle. The pattern indicates a trend continuation. The upper border is 1.1011, the lower border is 1.0962. The signal means that a short position should be opened after fixing a price below the lower border 1.0962 of the Bearish Rectangle.
The M5 and M15 time frames may have more false entry points.
Veja também
- All
- All
- Bearish Rectangle
- Bearish Symmetrical Triangle
- Bearish Symmetrical Triangle
- Bullish Rectangle
- Double Top
- Double Top
- Triple Bottom
- Triple Bottom
- Triple Top
- Triple Top
- All
- All
- Buy
- Sale
- All
- 1
- 2
- 3
- 4
- 5
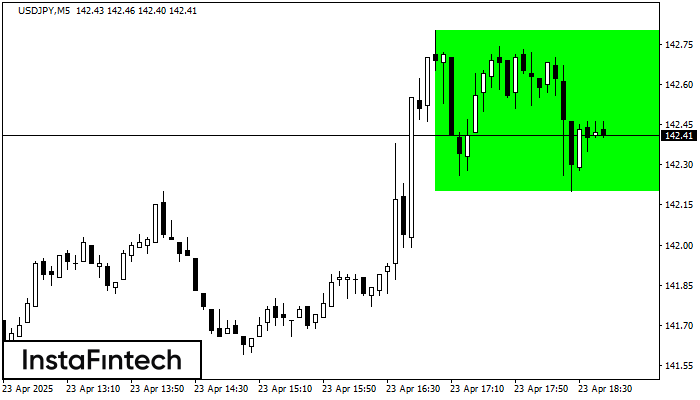
Retângulo de alta
was formed on 23.04 at 17:45:08 (UTC+0)
signal strength 1 of 5
De acordo com o gráfico de M5, USDJPY formou o Retângulo de alta que é um padrão de uma continuação da tendência. O padrão está dentro dos seguintes limites
Os intervalos M5 e M15 podem ter mais pontos de entrada falsos.
Open chart in a new window
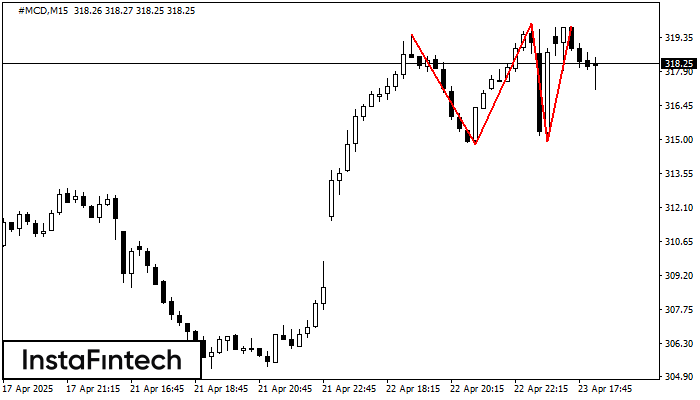
Topo triplo
was formed on 23.04 at 17:30:02 (UTC+0)
signal strength 2 of 5
O padrão Topo triplo foi formado no gráfico do instrumento de negociação #MCD M15. É um padrão de reversão com as seguintes características: nível de resistência -33, nível de suporte
Os intervalos M5 e M15 podem ter mais pontos de entrada falsos.
Open chart in a new window
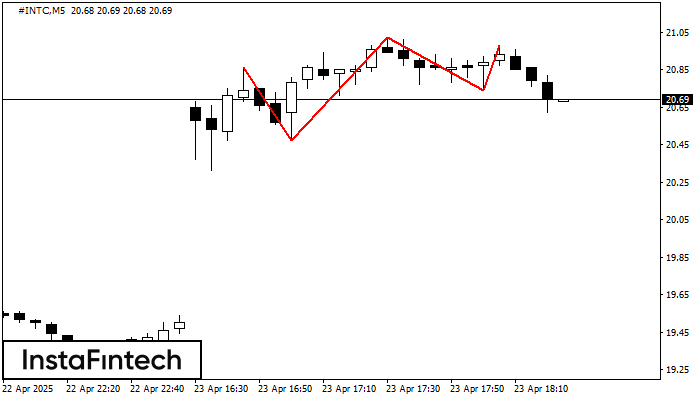
Topo triplo
was formed on 23.04 at 17:24:36 (UTC+0)
signal strength 1 of 5
O padrão Topo triplo foi formado no gráfico do instrumento de negociação #INTC M5. É um padrão de reversão com as seguintes características: nível de resistência -12, nível de suporte
Os intervalos M5 e M15 podem ter mais pontos de entrada falsos.
Open chart in a new window


