


Padrões são modelos gráficos que são formados no gráfico pelo preço. Segundo um dos postulados da análise técnica, a história (movimento de preços) se repete. Isso significa que os movimentos de preços geralmente são semelhantes nas mesmas situações, o que possibilita prever o desenvolvimento futuro da situação com alta probabilidade.
Os padrões relevantes da InstaTrade são um serviço fácil de usar, que permite que você esteja ciente das últimas mudanças no mercado e reaja a indícios do mercado a tempo. Em nosso serviço, você sempre encontrará os padrões mais recentes e relevantes em qualquer par e em qualquer período gráfico.
Triple Top
was formed on 31.03 at 13:45:42 (UTC+0)
signal strength 2 of 5
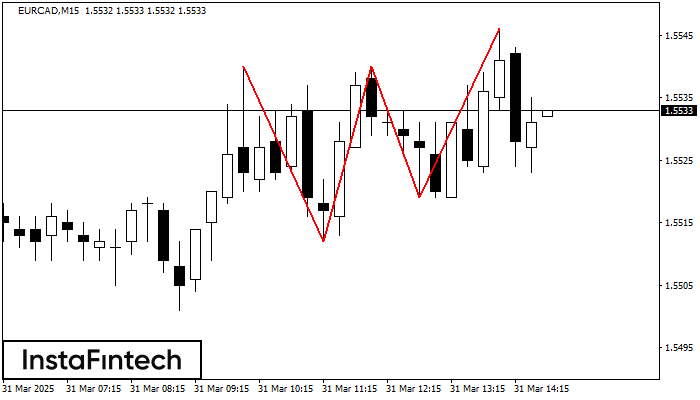
The Triple Top pattern has formed on the chart of the EURCAD M15. Features of the pattern: borders have an ascending angle; the lower line of the pattern has the coordinates 1.5512/1.5519 with the upper limit 1.5540/1.5546; the projection of the width is 28 points. The formation of the Triple Top figure most likely indicates a change in the trend from upward to downward. This means that in the event of a breakdown of the support level of 1.5512, the price is most likely to continue the downward movement.
The M5 and M15 time frames may have more false entry points.


