

Padrões atuais

Padrões são modelos gráficos que são formados no gráfico pelo preço. Segundo um dos postulados da análise técnica, a história (movimento de preços) se repete. Isso significa que os movimentos de preços geralmente são semelhantes nas mesmas situações, o que possibilita prever o desenvolvimento futuro da situação com alta probabilidade.
Os padrões relevantes da InstaTrade são um serviço fácil de usar, que permite que você esteja ciente das últimas mudanças no mercado e reaja a indícios do mercado a tempo. Em nosso serviço, você sempre encontrará os padrões mais recentes e relevantes em qualquer par e em qualquer período gráfico.
Bearish Symmetrical Triangle
was formed on 31.03 at 12:11:40 (UTC+0)
signal strength 1 of 5
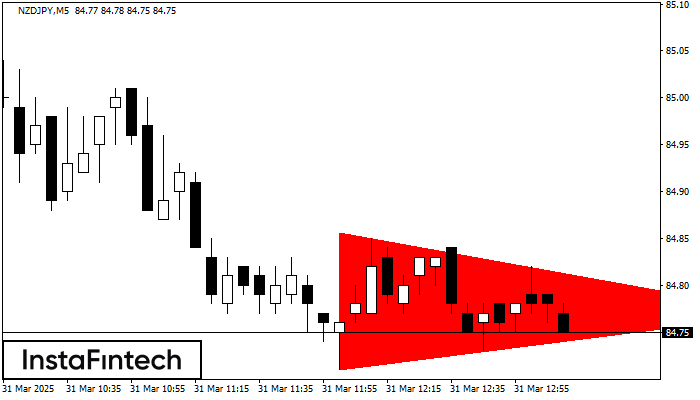
According to the chart of M5, NZDJPY formed the Bearish Symmetrical Triangle pattern. Trading recommendations: A breach of the lower border 84.71 is likely to encourage a continuation of the downward trend.
The M5 and M15 time frames may have more false entry points.
- All
- All
- Bearish Rectangle
- Bearish Symmetrical Triangle
- Bearish Symmetrical Triangle
- Bullish Rectangle
- Double Top
- Double Top
- Triple Bottom
- Triple Bottom
- Triple Top
- Triple Top
- All
- All
- Buy
- Sale
- All
- 1
- 2
- 3
- 4
- 5
Bullish Symmetrical Triangle
was formed on 25.04 at 20:26:21 (UTC+0)
signal strength 1 of 5
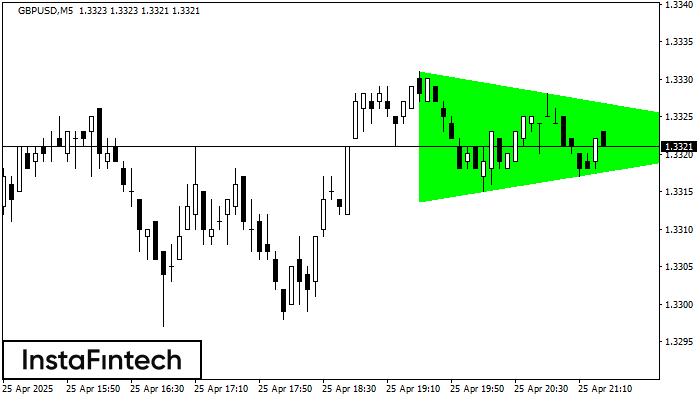
According to the chart of M5, GBPUSD formed the Bullish Symmetrical Triangle pattern, which signals the trend will continue. Description. The upper border of the pattern touches the coordinates 1.3331/1.3322
The M5 and M15 time frames may have more false entry points.
Open chart in a new window
Double Bottom
was formed on 25.04 at 20:20:19 (UTC+0)
signal strength 1 of 5
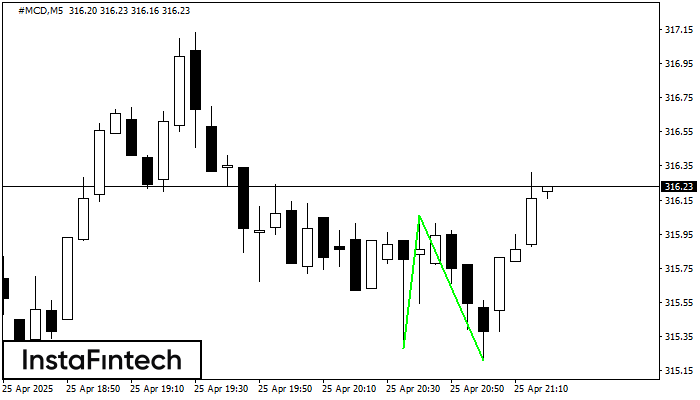
The Double Bottom pattern has been formed on #MCD M5; the upper boundary is 316.06; the lower boundary is 315.21. The width of the pattern is 78 points. In case
The M5 and M15 time frames may have more false entry points.
Open chart in a new window
Head and Shoulders
was formed on 25.04 at 20:00:22 (UTC+0)
signal strength 2 of 5
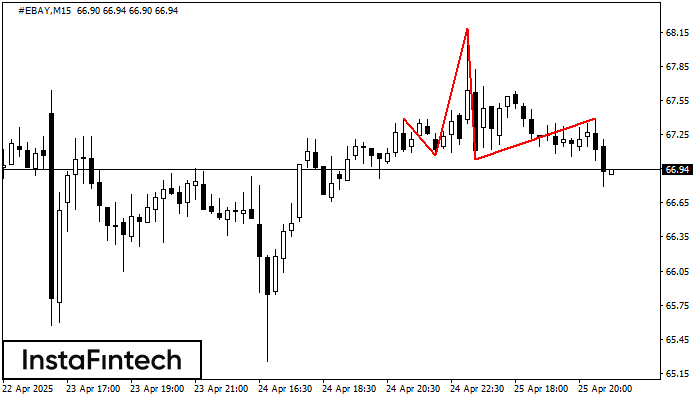
According to the chart of M15, #EBAY formed the Head and Shoulders pattern. The Head’s top is set at 68.18 while the median line of the Neck is found
The M5 and M15 time frames may have more false entry points.
Open chart in a new window


