

Padrões atuais

Padrões são modelos gráficos que são formados no gráfico pelo preço. Segundo um dos postulados da análise técnica, a história (movimento de preços) se repete. Isso significa que os movimentos de preços geralmente são semelhantes nas mesmas situações, o que possibilita prever o desenvolvimento futuro da situação com alta probabilidade.
Os padrões relevantes da InstaTrade são um serviço fácil de usar, que permite que você esteja ciente das últimas mudanças no mercado e reaja a indícios do mercado a tempo. Em nosso serviço, você sempre encontrará os padrões mais recentes e relevantes em qualquer par e em qualquer período gráfico.
Double Bottom
was formed on 31.03 at 00:51:02 (UTC+0)
signal strength 1 of 5
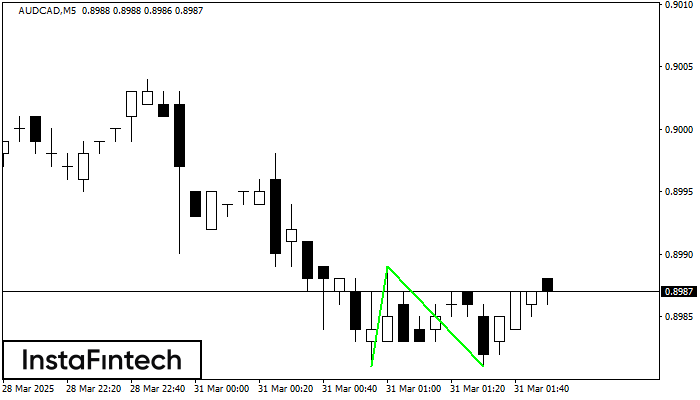
The Double Bottom pattern has been formed on AUDCAD M5. This formation signals a reversal of the trend from downwards to upwards. The signal is that a buy trade should be opened after the upper boundary of the pattern 0.8989 is broken. The further movements will rely on the width of the current pattern 8 points.
The M5 and M15 time frames may have more false entry points.
- All
- All
- Bearish Rectangle
- Bearish Symmetrical Triangle
- Bearish Symmetrical Triangle
- Bullish Rectangle
- Double Top
- Double Top
- Triple Bottom
- Triple Bottom
- Triple Top
- Triple Top
- All
- All
- Buy
- Sale
- All
- 1
- 2
- 3
- 4
- 5
Double Top
was formed on 27.04 at 22:05:29 (UTC+0)
signal strength 1 of 5
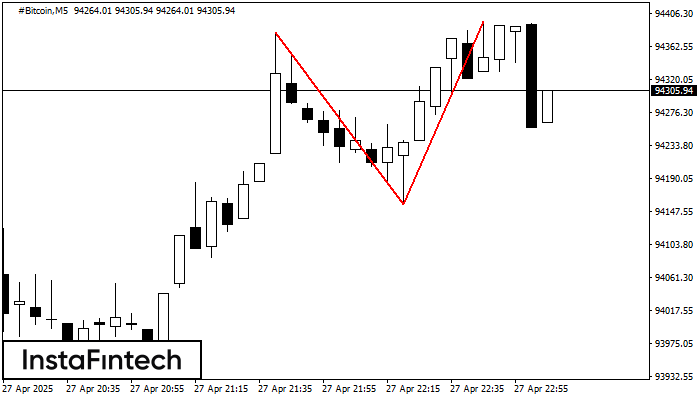
On the chart of #Bitcoin M5 the Double Top reversal pattern has been formed. Characteristics: the upper boundary 94395.37; the lower boundary 94157.00; the width of the pattern 23837 points
The M5 and M15 time frames may have more false entry points.
Open chart in a new window
Triple Bottom
was formed on 27.04 at 19:30:44 (UTC+0)
signal strength 3 of 5
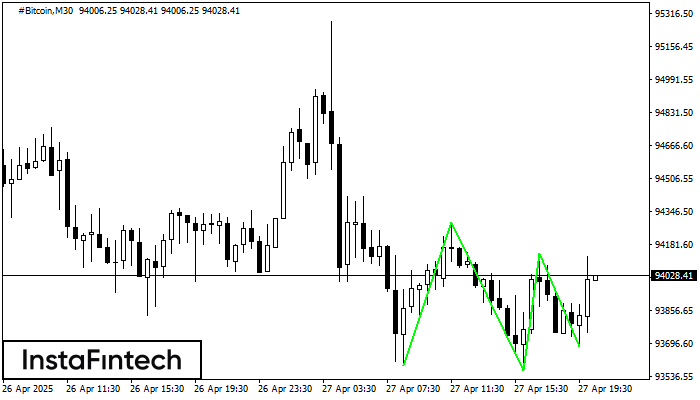
The Triple Bottom pattern has formed on the chart of #Bitcoin M30. Features of the pattern: The lower line of the pattern has coordinates 94291.97 with the upper limit 94291.97/94136.56
Open chart in a new window
Double Bottom
was formed on 27.04 at 16:59:46 (UTC+0)
signal strength 4 of 5
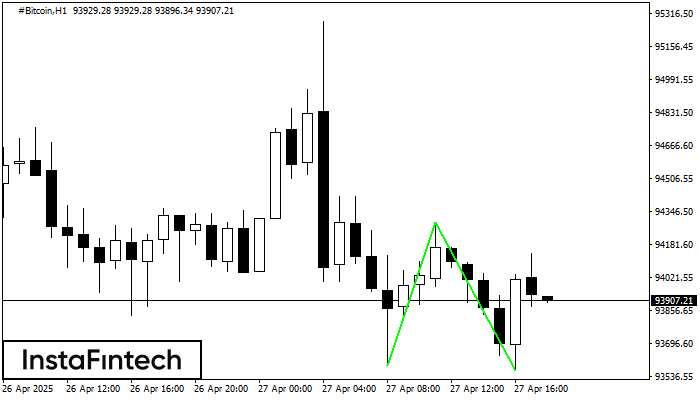
The Double Bottom pattern has been formed on #Bitcoin H1. This formation signals a reversal of the trend from downwards to upwards. The signal is that a buy trade should
Open chart in a new window


