Bullish Rectangle
was formed on 21.03 at 21:13:56 (UTC+0)
signal strength 1 of 5
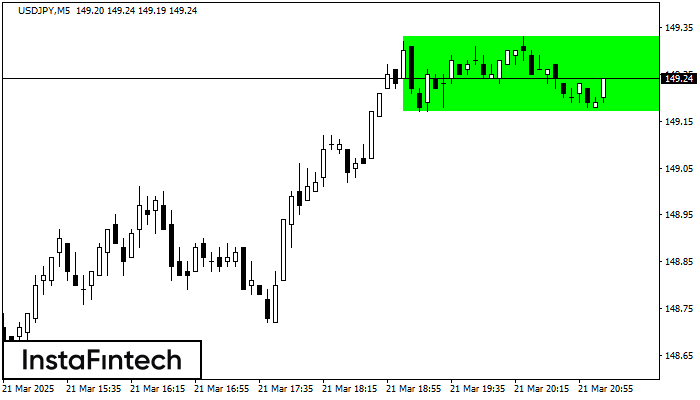
According to the chart of M5, USDJPY formed the Bullish Rectangle. The pattern indicates a trend continuation. The upper border is 149.33, the lower border is 149.17. The signal means that a long position should be opened above the upper border 149.33 of the Bullish Rectangle.
The M5 and M15 time frames may have more false entry points.
Veja também
- All
- All
- Bearish Rectangle
- Bearish Symmetrical Triangle
- Bullish Rectangle
- Double Top
- Double Top
- Triple Bottom
- Triple Bottom
- Triple Top
- Triple Top
- All
- All
- Buy
- Sale
- All
- 1
- 2
- 3
- 4
- 5
Fundo triplo
was formed on 31.03 at 01:40:32 (UTC+0)
signal strength 1 of 5
O padrão Fundo triplo foi formado no gráfico de EURCHF M5. Características do padrão: A linha inferior do padrão tem coordenadas 0.9536 com o limite superior 0.9536/0.9530, a projeção
Os intervalos M5 e M15 podem ter mais pontos de entrada falsos.
Open chart in a new window
Pennant de baixa
was formed on 31.03 at 01:30:12 (UTC+0)
signal strength 2 of 5
O padrão Pennant de baixa foi formado no gráfico NZDCAD M15. Este tipo de padrão é caracterizado por uma ligeira desaceleração após a qual o preço se moverá na direção
Os intervalos M5 e M15 podem ter mais pontos de entrada falsos.
Open chart in a new window
Pennant de baixa
was formed on 31.03 at 01:15:38 (UTC+0)
signal strength 2 of 5
O padrão Pennant de baixa foi formado no gráfico AUDUSD M15. Ele sinaliza a continuação potencial da tendência existente. Especificações: o fundo do padrão tem a coordenada de 0.6272;
Os intervalos M5 e M15 podem ter mais pontos de entrada falsos.
Open chart in a new window