

اصل پیٹرن یعنی ایکچوئل پیٹرن

پیٹرن تصویری صورت یعنی گرافکل ماڈلز ہوتے ہیں جو کہ چارٹ میں قیمت کی جانب سے بنتے ہیں جو کہ ٹیکنیکل تجزیات کے امکانات ، ہسٹری {قیمت کے اتار چڑھاو} چونکہ قیمت اپنے آپ کو دہراتی ہے - جس کا مطلب یہ ہے کہ قیمت کا اتار چڑھا یعنی حرکت ایک جیسے حالات میں ہی عموما مختلف ہوتی ہے جو کہ اس بات کو ممکن بناتی ہے قیمت کے مزید رویہ کی پیشن گوئی کی جاسکے جس کا اُسی طرح ہونے کے امکانات خاصے واضح ہوتے ہیں
انسٹا فاریکس کی "ریلی وینٹ" پیٹرنز نامی سروس استعمال میں بہت ہی آسان ہے جو کہ آپ کو مارکیٹ میں ہونے والی تازہ ترین تبدیلیوں کے حوالے باخبر رکھتے ہیں اور مارکیٹ کے ملنے والے اشاروں پر بر وقت در عمل دینے کے قابل کرتے ہیں - ہماری سہولیات سے آپ ہمیشہ پائیں گے تازہ ترین اور سب سے ذیادہ کار آمد انداز یعنی ریلی وینٹ انداز دستیاب ہوں گے- جو کہ کسی بھی پئیر اور ٹائم فریم کے حوالے سے دستیاب ہوں گے
Triple Bottom
was formed on 08.04 at 02:15:19 (UTC+0)
signal strength 2 of 5
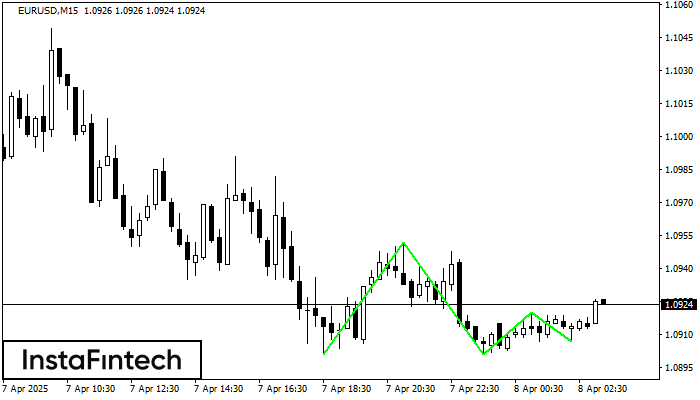
The Triple Bottom pattern has been formed on EURUSD M15. It has the following characteristics: resistance level 1.0952/1.0920; support level 1.0901/1.0907; the width is 51 points. In the event of a breakdown of the resistance level of 1.0952, the price is likely to continue an upward movement at least to 1.0924.
The M5 and M15 time frames may have more false entry points.
- All
- All
- Bearish Rectangle
- Bearish Symmetrical Triangle
- Bearish Symmetrical Triangle
- Bullish Rectangle
- Double Top
- Double Top
- Triple Bottom
- Triple Bottom
- Triple Top
- Triple Top
- All
- All
- Buy
- Sale
- All
- 1
- 2
- 3
- 4
- 5
Bawah Triple
was formed on 21.04 at 19:40:14 (UTC+0)
signal strength 1 of 5
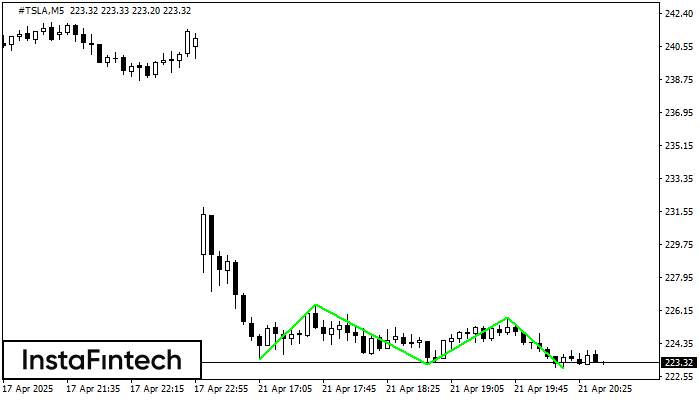
Pola Bawah Triple telah terbentuk pada grafik instrumen trading #TSLA M5. Pola tersebut menandakan perubahan dalam trend dari menurun menjadi naik jika terjadi pemecahan (breakdown) 226.48/225.78
Rangka waktu M5 dan M15 mungkin memiliki lebih dari titik entri yang keliru.
Open chart in a new window
Bawah Triple
was formed on 21.04 at 19:40:12 (UTC+0)
signal strength 1 of 5

Pola Bawah Triple telah terbentuk pada grafik #TSLA M5. Fitur-fitur pola: garis bawah pola memiliki koordinat 226.48 dengan batas atas 226.48/225.78, proyeksi lebar adalah 301 poin. Pembentukan pola Bawah Triple
Rangka waktu M5 dan M15 mungkin memiliki lebih dari titik entri yang keliru.
Open chart in a new window
Bawah Ganda
was formed on 21.04 at 19:20:14 (UTC+0)
signal strength 1 of 5
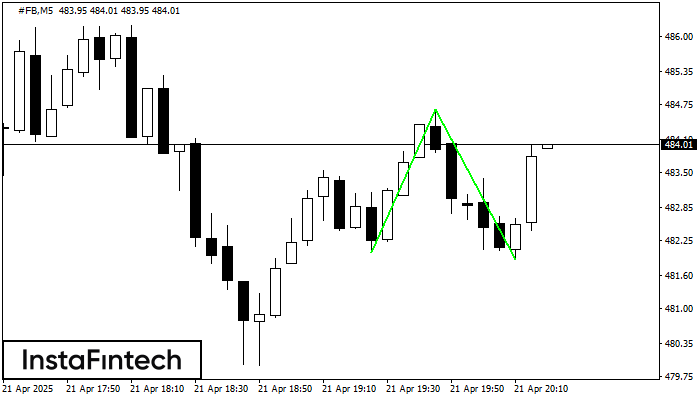
Pola Bawah Ganda telah terbentuk pada #FB M5; batas atas di 484.65; batas bawah di 481.90. Lebar pola sebesar 263 poin. Jika harga menembus batas atas 484.65, Perubahan dalam tren
Rangka waktu M5 dan M15 mungkin memiliki lebih dari titik entri yang keliru.
Open chart in a new window


