

اصل پیٹرن یعنی ایکچوئل پیٹرن

پیٹرن تصویری صورت یعنی گرافکل ماڈلز ہوتے ہیں جو کہ چارٹ میں قیمت کی جانب سے بنتے ہیں جو کہ ٹیکنیکل تجزیات کے امکانات ، ہسٹری {قیمت کے اتار چڑھاو} چونکہ قیمت اپنے آپ کو دہراتی ہے - جس کا مطلب یہ ہے کہ قیمت کا اتار چڑھا یعنی حرکت ایک جیسے حالات میں ہی عموما مختلف ہوتی ہے جو کہ اس بات کو ممکن بناتی ہے قیمت کے مزید رویہ کی پیشن گوئی کی جاسکے جس کا اُسی طرح ہونے کے امکانات خاصے واضح ہوتے ہیں
انسٹا فاریکس کی "ریلی وینٹ" پیٹرنز نامی سروس استعمال میں بہت ہی آسان ہے جو کہ آپ کو مارکیٹ میں ہونے والی تازہ ترین تبدیلیوں کے حوالے باخبر رکھتے ہیں اور مارکیٹ کے ملنے والے اشاروں پر بر وقت در عمل دینے کے قابل کرتے ہیں - ہماری سہولیات سے آپ ہمیشہ پائیں گے تازہ ترین اور سب سے ذیادہ کار آمد انداز یعنی ریلی وینٹ انداز دستیاب ہوں گے- جو کہ کسی بھی پئیر اور ٹائم فریم کے حوالے سے دستیاب ہوں گے
Bearish Symmetrical Triangle
was formed on 03.04 at 03:22:08 (UTC+0)
signal strength 1 of 5
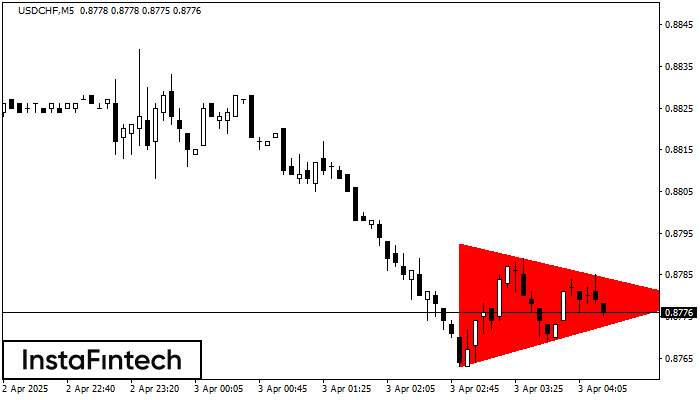
According to the chart of M5, USDCHF formed the Bearish Symmetrical Triangle pattern. This pattern signals a further downward trend in case the lower border 0.8763 is breached. Here, a hypothetical profit will equal the width of the available pattern that is -30 pips.
The M5 and M15 time frames may have more false entry points.
یہ بھی دیکھیں
- All
- All
- Bearish Rectangle
- Bearish Symmetrical Triangle
- Bearish Symmetrical Triangle
- Bullish Rectangle
- Double Top
- Double Top
- Triple Bottom
- Triple Bottom
- Triple Top
- Triple Top
- All
- All
- Buy
- Sale
- All
- 1
- 2
- 3
- 4
- 5
Bawah Ganda
was formed on 20.04 at 18:15:23 (UTC+0)
signal strength 1 of 5

Pola Bawah Ganda telah terbentuk pada #Bitcoin M5; batas atas di 84636.40; batas bawah di 84234.35. Lebar pola sebesar 42295 poin. Jika harga menembus batas atas 84636.40, Perubahan dalam tren
Rangka waktu M5 dan M15 mungkin memiliki lebih dari titik entri yang keliru.
Open chart in a new window
Teratas Ganda
was formed on 20.04 at 00:11:29 (UTC+0)
signal strength 1 of 5

Pola Teratas Ganda telah terbentuk pada #Bitcoin M5. Pola ini menandakan bahwa tren telah berubah dari kenaikan menjadi penurunan. Mungkin, jika dasar pola di 85200.45 ditembus, maka pergerakan menurun akan
Rangka waktu M5 dan M15 mungkin memiliki lebih dari titik entri yang keliru.
Open chart in a new window
Persegi Bullish
was formed on 19.04 at 17:03:40 (UTC+0)
signal strength 1 of 5

Menurut grafik dari M5, #Bitcoin terbentuk Persegi Bullish. Jenis pola ini menunjukkan kelanjutan tren. Terdiri dari dua tingkat: resistance 85457.12 dan support 85308.07. Jika level resistance 85457.12 - 85457.12 ditembus
Rangka waktu M5 dan M15 mungkin memiliki lebih dari titik entri yang keliru.
Open chart in a new window


