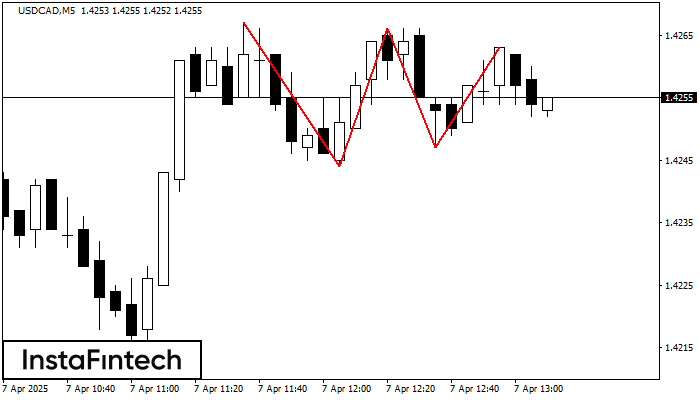
Triple Top
was formed on 07.04 at 12:10:10 (UTC+0)
signal strength 1 of 5

On the chart of the USDCAD M5 trading instrument, the Triple Top pattern that signals a trend change has formed. It is possible that after formation of the third peak, the price will try to break through the resistance level 1.4244, where we advise to open a trading position for sale. Take profit is the projection of the pattern’s width, which is 23 points.
The M5 and M15 time frames may have more false entry points.
- All
- All
- Bearish Rectangle
- Bearish Symmetrical Triangle
- Bearish Symmetrical Triangle
- Bullish Rectangle
- Double Top
- Double Top
- Triple Bottom
- Triple Bottom
- Triple Top
- Triple Top
- All
- All
- Buy
- Sale
- All
- 1
- 2
- 3
- 4
- 5
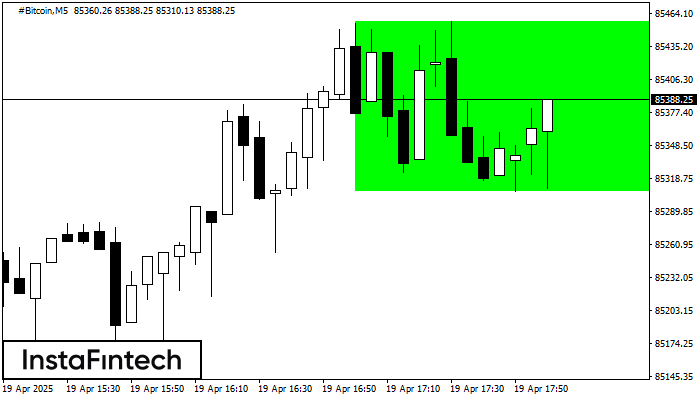
बुलिश आयत
was formed on 19.04 at 17:03:40 (UTC+0)
signal strength 1 of 5
M5 के चार्ट के अनुसार, #Bitcoin से बुलिश आयत बना। इस प्रकार का पैटर्न प्रवृत्ति की निरंतरता कि ओर इंगित करता है। इसमें दो स्तर होते हैं: प्रतिरोध 85457.12
M5 और M15 समय सीमा में अधिक फाल्स एंट्री पॉइंट्स हो सकते हैं।
Open chart in a new window
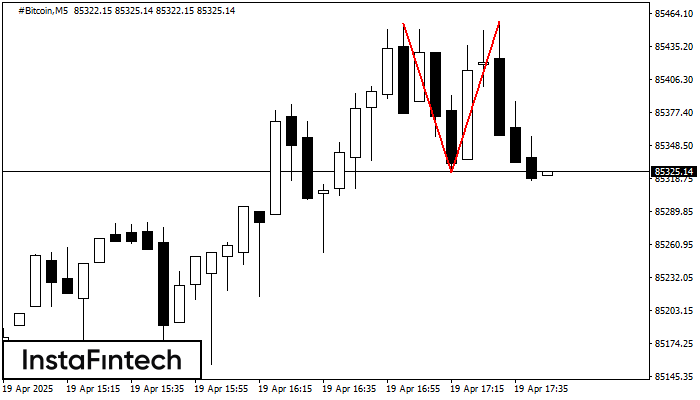
डबल टॉप
was formed on 19.04 at 16:44:37 (UTC+0)
signal strength 1 of 5
#Bitcoin M5 पर डबल टॉप रीवर्सल पैटर्न बना है। विशेषताएं: ऊपरी सीमा 85455.73; निचली सीमा 85324.27; पैटर्न की चौड़ाई 13285 पॉइंट्स है। सेल ट्रेडों को 85324.27 की निचली सीमा के
M5 और M15 समय सीमा में अधिक फाल्स एंट्री पॉइंट्स हो सकते हैं।
Open chart in a new window
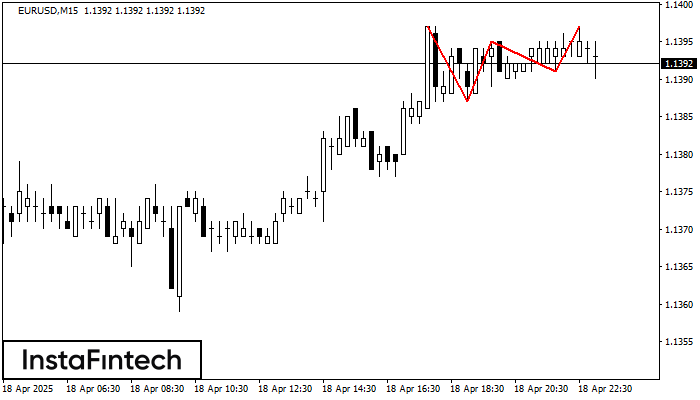
ट्रिपल टॉप
was formed on 18.04 at 22:15:20 (UTC+0)
signal strength 2 of 5
EURUSD M15 के चार्ट पर ट्रिपल टॉप पैटर्न बना है। पैटर्न की विशेषताएं: सीमाओं में एक आरोही कोण मौजूद है; पैटर्न की निचली रेखा 1.1387/1.1391 पर है और ऊपरी सीमा
M5 और M15 समय सीमा में अधिक फाल्स एंट्री पॉइंट्स हो सकते हैं।
Open chart in a new window


