

Actual patterns

Patterns are graphical models which are formed in the chart by the price. According to one of the technical analysis postulates, history (price movement) repeats itself. It means that the price movements are often similar in the same situations which makes it possible to predict the further development of the situation with a high probability.
Relevant patterns by InstaTrade is an easy-to-use service which allows you to be aware of latest changes in the market and react to clues from the market in time. In our service you will always find the latest and most relevant patterns on any pair and any timeframe.
Head and Shoulders
was formed on 06.04 at 23:16:38 (UTC+0)
signal strength 2 of 5
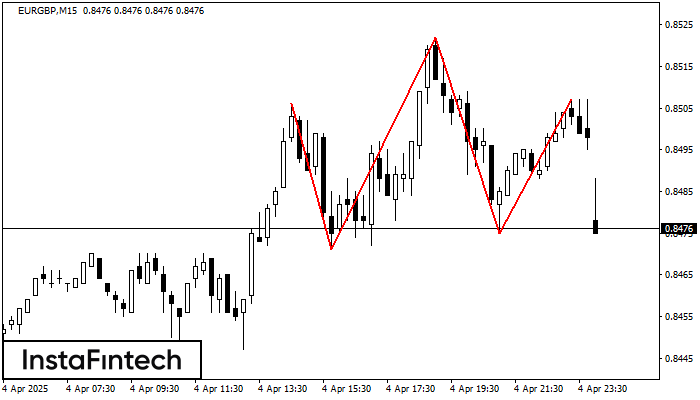
According to the chart of M15, EURGBP formed the Head and Shoulders pattern. The Head’s top is set at 0.8522 while the median line of the Neck is found at 0.8471/0.8475. The formation of the Head and Shoulders pattern evidently signals a reversal of the upward trend. In other words, in case the scenario comes true, the price of EURGBP will go towards 0.8453.
The M5 and M15 time frames may have more false entry points.
See Also
- All
- All
- Bearish Rectangle
- Bearish Symmetrical Triangle
- Bearish Symmetrical Triangle
- Bullish Rectangle
- Double Top
- Double Top
- Triple Bottom
- Triple Bottom
- Triple Top
- Triple Top
- All
- All
- Buy
- Sale
- All
- 1
- 2
- 3
- 4
- 5
Triple Techo
was formed on 18.04 at 22:15:20 (UTC+0)
signal strength 2 of 5

El patrón Triple Techo ha sido formado en el gráfico de EURUSD M15. Características del patrón: los límites tienen un ángulo ascendente, la línea inferior del patrón tiene coordenadas 1.1387/1.1391
Los marcos de tiempo M5 y M15 pueden tener más puntos de entrada falsos.
Open chart in a new window
Rectángulo Bajista
was formed on 18.04 at 21:51:06 (UTC+0)
signal strength 2 of 5

Según el gráfico de M15, NZDCAD formó el Rectángulo Bajista. Este tipo de patrón indica la continuación de una tendencia. Esto consiste de dos niveles: resistencia 0.8222 - 0.0000
Los marcos de tiempo M5 y M15 pueden tener más puntos de entrada falsos.
Open chart in a new window
Doble Piso
was formed on 18.04 at 21:45:06 (UTC+0)
signal strength 2 of 5

El patrón Doble Piso ha sido formado en USDJPY M15; el límite superior es 142.30; el límite inferior es 142.14. El ancho del patrón es 17 puntos. En caso
Los marcos de tiempo M5 y M15 pueden tener más puntos de entrada falsos.
Open chart in a new window


