

Actual patterns

Patterns are graphical models which are formed in the chart by the price. According to one of the technical analysis postulates, history (price movement) repeats itself. It means that the price movements are often similar in the same situations which makes it possible to predict the further development of the situation with a high probability.
Relevant patterns by InstaTrade is an easy-to-use service which allows you to be aware of latest changes in the market and react to clues from the market in time. In our service you will always find the latest and most relevant patterns on any pair and any timeframe.
Bearish Flag
was formed on 25.03 at 15:01:42 (UTC+0)
signal strength 1 of 5
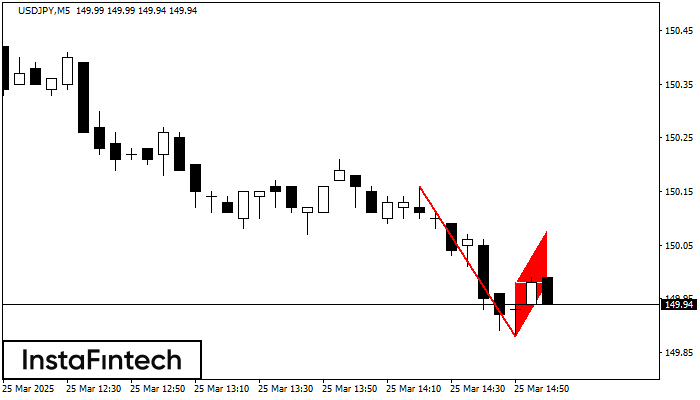
The Bearish Flag pattern has been formed on the chart USDJPY M5. Therefore, the downwards trend is likely to continue in the nearest term. As soon as the price breaks below the low at 149.88, traders should enter the market.
The M5 and M15 time frames may have more false entry points.
See Also
- All
- All
- Bearish Rectangle
- Bearish Symmetrical Triangle
- Bearish Symmetrical Triangle
- Bullish Rectangle
- Double Top
- Double Top
- Triple Bottom
- Triple Bottom
- Triple Top
- Triple Top
- All
- All
- Buy
- Sale
- All
- 1
- 2
- 3
- 4
- 5
Doble Techo
was formed on 18.04 at 21:35:26 (UTC+0)
signal strength 1 of 5

El patrón Doble Techo ha sido formado en #Bitcoin M5. Esto señala que la tendencia ha sido cambiada de alcista a bajista. Probablemente, si la base del patrón 84518.26
Los marcos de tiempo M5 y M15 pueden tener más puntos de entrada falsos.
Open chart in a new window
Triángulo Simétrico Alcista
was formed on 18.04 at 21:02:57 (UTC+0)
signal strength 2 of 5

Según el gráfico de M15, EURJPY formó el patrón Triángulo Simétrico Alcista, que señala que la tendencia continuará. Descripción. El límite superior del patrón toca las coordenadas 162.14/161.96 donde
Los marcos de tiempo M5 y M15 pueden tener más puntos de entrada falsos.
Open chart in a new window
Triángulo Simétrico Alcista
was formed on 18.04 at 20:46:25 (UTC+0)
signal strength 1 of 5

Según el gráfico de M5, EURJPY formó el patrón Triángulo Simétrico Alcista, que señala que la tendencia continuará. Descripción. El límite superior del patrón toca las coordenadas 162.14/161.98 donde
Los marcos de tiempo M5 y M15 pueden tener más puntos de entrada falsos.
Open chart in a new window


