

Actual patterns

Patterns are graphical models which are formed in the chart by the price. According to one of the technical analysis postulates, history (price movement) repeats itself. It means that the price movements are often similar in the same situations which makes it possible to predict the further development of the situation with a high probability.
Relevant patterns by InstaTrade is an easy-to-use service which allows you to be aware of latest changes in the market and react to clues from the market in time. In our service you will always find the latest and most relevant patterns on any pair and any timeframe.
Double Top
was formed on 25.03 at 14:00:18 (UTC+0)
signal strength 1 of 5
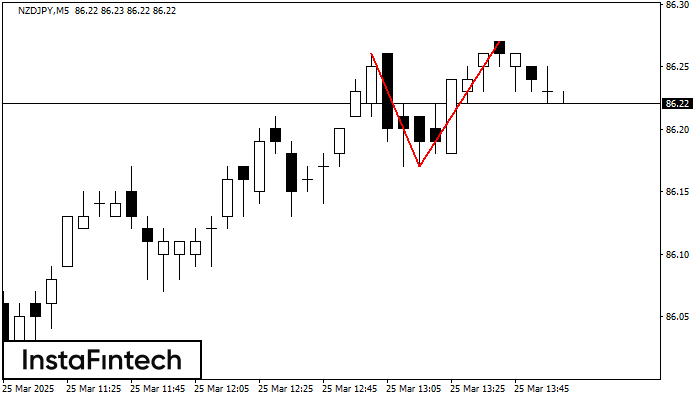
The Double Top reversal pattern has been formed on NZDJPY M5. Characteristics: the upper boundary 86.26; the lower boundary 86.17; the width of the pattern is 10 points. Sell trades are better to be opened below the lower boundary 86.17 with a possible movements towards the 86.02 level.
The M5 and M15 time frames may have more false entry points.
- All
- All
- Bearish Rectangle
- Bearish Symmetrical Triangle
- Bearish Symmetrical Triangle
- Bullish Rectangle
- Double Top
- Double Top
- Triple Bottom
- Triple Bottom
- Triple Top
- Triple Top
- All
- All
- Buy
- Sale
- All
- 1
- 2
- 3
- 4
- 5
Triple Top
was formed on 18.04 at 22:15:20 (UTC+0)
signal strength 2 of 5

The Triple Top pattern has formed on the chart of the EURUSD M15. Features of the pattern: borders have an ascending angle; the lower line of the pattern
The M5 and M15 time frames may have more false entry points.
Open chart in a new window
Bearish Rectangle
was formed on 18.04 at 21:51:06 (UTC+0)
signal strength 2 of 5

According to the chart of M15, NZDCAD formed the Bearish Rectangle. This type of a pattern indicates a trend continuation. It consists of two levels: resistance 0.8222 - 0.0000
The M5 and M15 time frames may have more false entry points.
Open chart in a new window
Double Bottom
was formed on 18.04 at 21:45:06 (UTC+0)
signal strength 2 of 5

The Double Bottom pattern has been formed on USDJPY M15; the upper boundary is 142.30; the lower boundary is 142.14. The width of the pattern is 17 points. In case
The M5 and M15 time frames may have more false entry points.
Open chart in a new window
Double Top
was formed on 18.04 at 21:35:26 (UTC+0)
signal strength 1 of 5

The Double Top pattern has been formed on #Bitcoin M5. It signals that the trend has been changed from upwards to downwards. Probably, if the base of the pattern 84518.26
The M5 and M15 time frames may have more false entry points.
Open chart in a new window
Bullish Symmetrical Triangle
was formed on 18.04 at 21:02:57 (UTC+0)
signal strength 2 of 5

According to the chart of M15, EURJPY formed the Bullish Symmetrical Triangle pattern, which signals the trend will continue. Description. The upper border of the pattern touches the coordinates 162.14/161.96
The M5 and M15 time frames may have more false entry points.
Open chart in a new window
Bullish Symmetrical Triangle
was formed on 18.04 at 20:46:25 (UTC+0)
signal strength 1 of 5

According to the chart of M5, EURJPY formed the Bullish Symmetrical Triangle pattern, which signals the trend will continue. Description. The upper border of the pattern touches the coordinates 162.14/161.98
The M5 and M15 time frames may have more false entry points.
Open chart in a new window
Triple Bottom
was formed on 18.04 at 20:20:31 (UTC+0)
signal strength 1 of 5

The Triple Bottom pattern has been formed on GBPAUD M5. It has the following characteristics: resistance level 2.0835/2.0826; support level 2.0821/2.0823; the width is 14 points. In the event
The M5 and M15 time frames may have more false entry points.
Open chart in a new window
Triple Bottom
was formed on 18.04 at 20:00:39 (UTC+0)
signal strength 2 of 5

The Triple Bottom pattern has formed on the chart of AUDCAD M15. Features of the pattern: The lower line of the pattern has coordinates 0.8845 with the upper limit 0.8845/0.8836
The M5 and M15 time frames may have more false entry points.
Open chart in a new window
Triple Bottom
was formed on 18.04 at 20:00:30 (UTC+0)
signal strength 2 of 5

The Triple Bottom pattern has formed on the chart of the NZDCHF M15 trading instrument. The pattern signals a change in the trend from downwards to upwards in the case
The M5 and M15 time frames may have more false entry points.
Open chart in a new window


