

Долзарб паттернлар

Тройная вершина
сформирован 02.04 в 16:00:28 (UTC+0)
сила сигнала 2 из 5
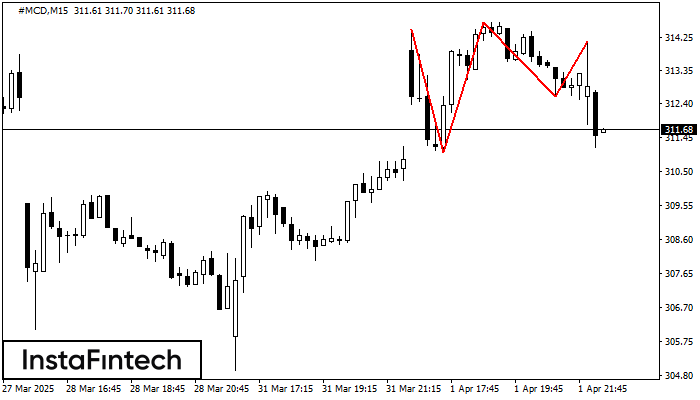
На графике #MCD M15 образовалась фигура «Тройная вершина», которая сигнализирует об изменении тенденции. Возможный сценарий: После формирования третьей вершины котировка постарается пробить нижнюю границу 312.60, где трейдеру и стоило бы открывать торговую позицию на продажу. Тейк Профит - это и есть проекция ширины фигуры, которая составляет 209 пунктов.
Таймфреймы М5 и М15 могут иметь больше ложных точек входа.
- Все
- Все
- Bearish Rectangle
- Bearish Symmetrical Triangle
- Bearish Symmetrical Triangle
- Bullish Rectangle
- Double Top
- Double Top
- Triple Bottom
- Triple Bottom
- Triple Top
- Triple Top
- Все
- Все
- Покупка
- Продажа
- Все
- 1
- 2
- 3
- 4
- 5
Bullish Symmetrical Triangle
was formed on 16.04 at 06:40:55 (UTC+0)
signal strength 2 of 5

According to the chart of M15, AUDCAD formed the Bullish Symmetrical Triangle pattern. The lower border of the pattern touches the coordinates 0.8813/0.8844 whereas the upper border goes across 0.8874/0.8844
The M5 and M15 time frames may have more false entry points.
Open chart in a new window
Double Bottom
was formed on 16.04 at 06:31:16 (UTC+0)
signal strength 2 of 5
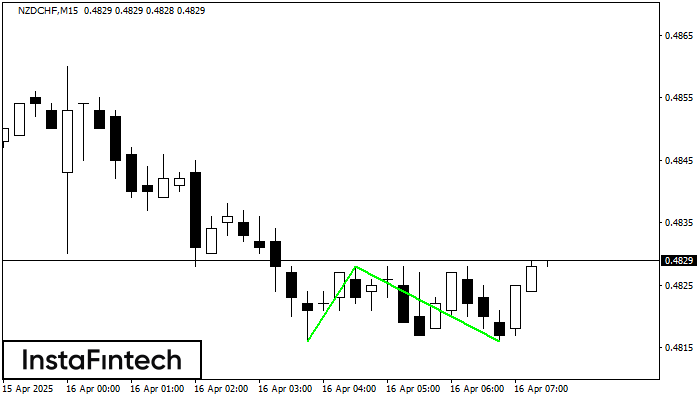
The Double Bottom pattern has been formed on NZDCHF M15; the upper boundary is 0.4828; the lower boundary is 0.4816. The width of the pattern is 12 points. In case
The M5 and M15 time frames may have more false entry points.
Open chart in a new window
Bearish Rectangle
was formed on 16.04 at 05:35:30 (UTC+0)
signal strength 1 of 5
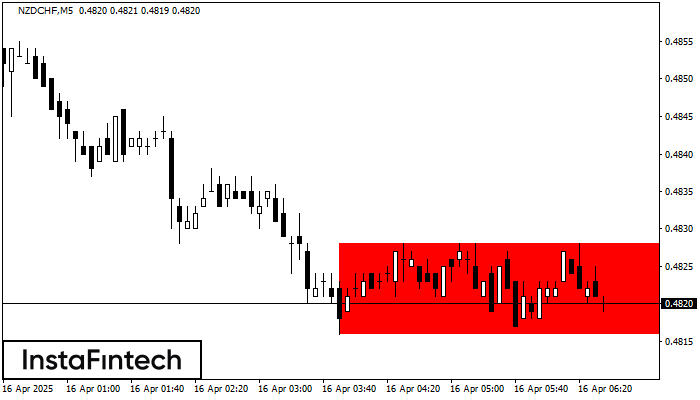
According to the chart of M5, NZDCHF formed the Bearish Rectangle. This type of a pattern indicates a trend continuation. It consists of two levels: resistance 0.4828 - 0.0000
The M5 and M15 time frames may have more false entry points.
Open chart in a new window


