

Долзарб паттернлар

Двойное дно
сформирован 31.03 в 05:35:10 (UTC+0)
сила сигнала 1 из 5

Сформирована фигура «Двойное дно» на графике USDJPY M5. Характеристика: Уровень поддержки 148.74; Уровень сопротивления 148.96; Ширина фигуры 22 пунктов. В случае пробоя уровня сопротивления можно будет прогнозировать изменение тенденции, где первая точка фиксации прибыли находится на расстоянии 21 пунктов.
Таймфреймы М5 и М15 могут иметь больше ложных точек входа.
Шунингдек кўринг
- Все
- Все
- Bearish Rectangle
- Bearish Symmetrical Triangle
- Bearish Symmetrical Triangle
- Bullish Rectangle
- Double Top
- Double Top
- Triple Bottom
- Triple Bottom
- Triple Top
- Triple Top
- Все
- Все
- Покупка
- Продажа
- Все
- 1
- 2
- 3
- 4
- 5
Double Bottom
was formed on 22.04 at 12:00:18 (UTC+0)
signal strength 1 of 5
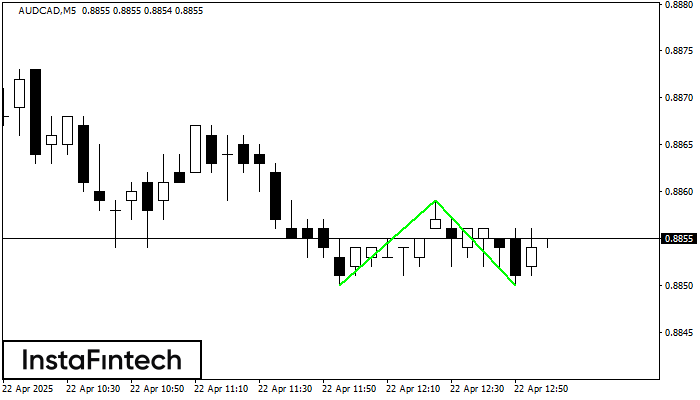
The Double Bottom pattern has been formed on AUDCAD M5. Characteristics: the support level 0.8850; the resistance level 0.8859; the width of the pattern 9 points. If the resistance level
The M5 and M15 time frames may have more false entry points.
Open chart in a new window
Double Bottom
was formed on 22.04 at 11:50:17 (UTC+0)
signal strength 1 of 5
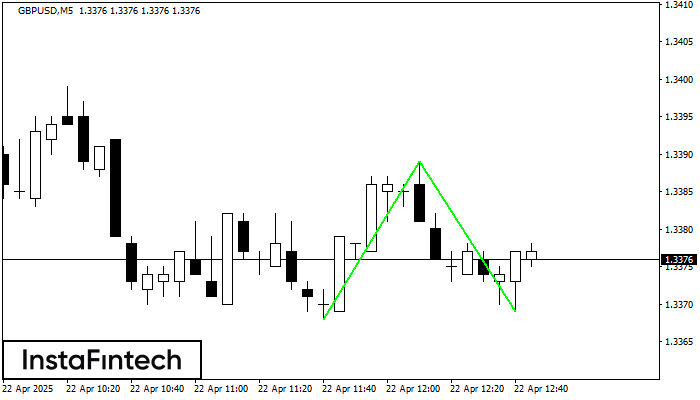
The Double Bottom pattern has been formed on GBPUSD M5; the upper boundary is 1.3389; the lower boundary is 1.3369. The width of the pattern is 21 points. In case
The M5 and M15 time frames may have more false entry points.
Open chart in a new window
Bullish Symmetrical Triangle
was formed on 22.04 at 11:39:27 (UTC+0)
signal strength 1 of 5
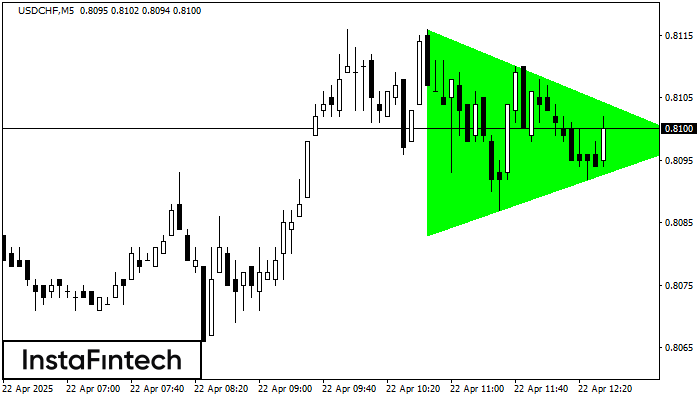
According to the chart of M5, USDCHF formed the Bullish Symmetrical Triangle pattern. The lower border of the pattern touches the coordinates 0.8083/0.8098 whereas the upper border goes across 0.8116/0.8098
The M5 and M15 time frames may have more false entry points.
Open chart in a new window


