

Долзарб паттернлар

Двойная вершина
сформирован 27.03 в 21:55:24 (UTC+0)
сила сигнала 1 из 5
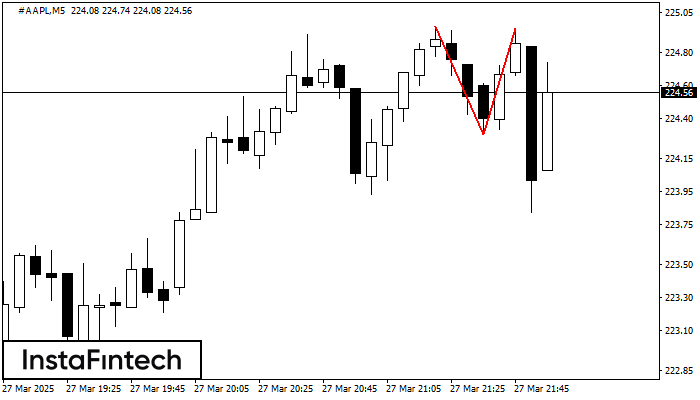
По #AAPL на M5 сформировалась разворотная фигура «Двойная вершина». Характеристика: Верхняя граница 224.96; Нижняя граница 224.30; Ширина фигуры 65 пунктов. Позицию на продажу возможно открыть ниже нижней границы 224.30, с перспективой хода к уровню 224.15.
Таймфреймы М5 и М15 могут иметь больше ложных точек входа.
- Все
- Все
- Bearish Rectangle
- Bearish Symmetrical Triangle
- Bearish Symmetrical Triangle
- Bullish Rectangle
- Double Top
- Double Top
- Triple Bottom
- Triple Bottom
- Triple Top
- Triple Top
- Все
- Все
- Покупка
- Продажа
- Все
- 1
- 2
- 3
- 4
- 5
Triple Top
was formed on 18.04 at 22:15:20 (UTC+0)
signal strength 2 of 5

The Triple Top pattern has formed on the chart of the EURUSD M15. Features of the pattern: borders have an ascending angle; the lower line of the pattern
The M5 and M15 time frames may have more false entry points.
Open chart in a new window
Bearish Rectangle
was formed on 18.04 at 21:51:06 (UTC+0)
signal strength 2 of 5

According to the chart of M15, NZDCAD formed the Bearish Rectangle. This type of a pattern indicates a trend continuation. It consists of two levels: resistance 0.8222 - 0.0000
The M5 and M15 time frames may have more false entry points.
Open chart in a new window
Double Bottom
was formed on 18.04 at 21:45:06 (UTC+0)
signal strength 2 of 5

The Double Bottom pattern has been formed on USDJPY M15; the upper boundary is 142.30; the lower boundary is 142.14. The width of the pattern is 17 points. In case
The M5 and M15 time frames may have more false entry points.
Open chart in a new window


