Actual patterns

Patterns are graphical models which are formed in the chart by the price. According to one of the technical analysis postulates, history (price movement) repeats itself. It means that the price movements are often similar in the same situations which makes it possible to predict the further development of the situation with a high probability.
Relevant patterns by InstaTrade is an easy-to-use service which allows you to be aware of latest changes in the market and react to clues from the market in time. In our service you will always find the latest and most relevant patterns on any pair and any timeframe.
Bullish Symmetrical Triangle
was formed on 31.03 at 11:25:28 (UTC+0)
signal strength 1 of 5
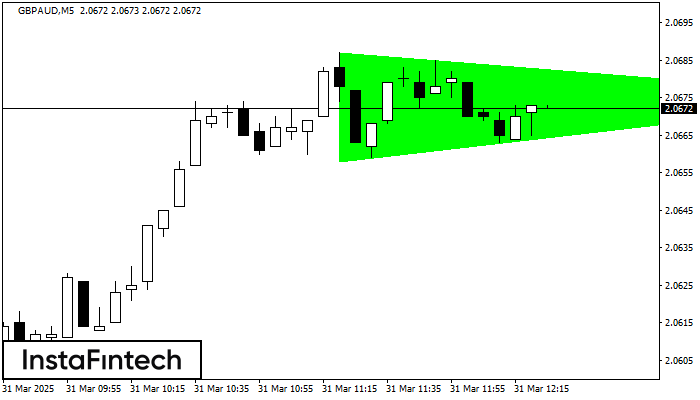
According to the chart of M5, GBPAUD formed the Bullish Symmetrical Triangle pattern. The lower border of the pattern touches the coordinates 2.0658/2.0675 whereas the upper border goes across 2.0687/2.0675. If the Bullish Symmetrical Triangle pattern is in progress, this evidently signals a further upward trend. In other words, in case the scenario comes true, the price of GBPAUD will breach the upper border to head for 2.0690.
The M5 and M15 time frames may have more false entry points.
See Also
- All
- All
- Bearish Rectangle
- Bearish Symmetrical Triangle
- Bearish Symmetrical Triangle
- Bullish Rectangle
- Double Top
- Double Top
- Triple Bottom
- Triple Bottom
- Triple Top
- Triple Top
- All
- All
- Buy
- Sale
- All
- 1
- 2
- 3
- 4
- 5
Double Top
сформирован 14.04 в 16:45:14 (UTC+0)
сила сигнала 2 из 5
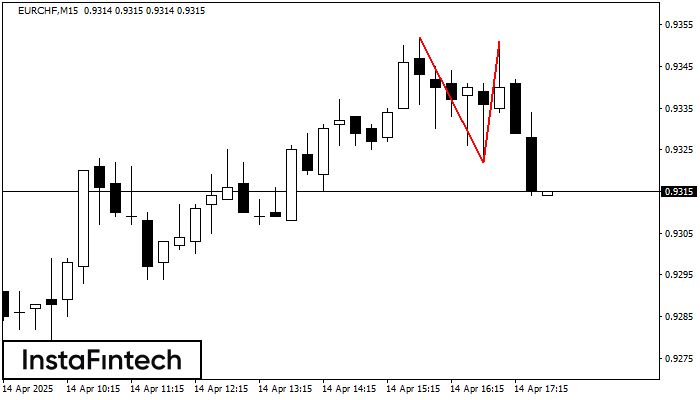
On the chart of EURCHF M15 the Double Top reversal pattern has been formed. Characteristics: the upper boundary 0.9351; the lower boundary 0.9322; the width of the pattern 29 points
The M5 and M15 time frames may have more false entry points.
Открыть график инструмента в новом окне
Bearish Rectangle
сформирован 14.04 в 16:42:50 (UTC+0)
сила сигнала 1 из 5
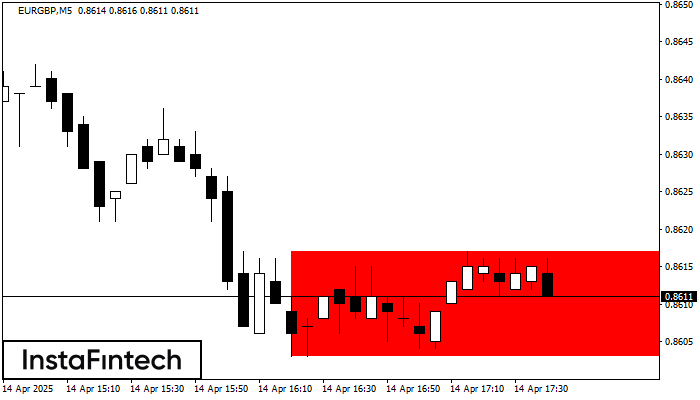
According to the chart of M5, EURGBP formed the Bearish Rectangle. The pattern indicates a trend continuation. The upper border is 0.8617, the lower border is 0.8603. The signal means
The M5 and M15 time frames may have more false entry points.
Открыть график инструмента в новом окне
Bullish pennant
сформирован 14.04 в 16:05:59 (UTC+0)
сила сигнала 1 из 5

The Bullish pennant graphic pattern has formed on the #AAPL M5 instrument. This pattern type falls under the category of continuation patterns. In this case, if the quote can breaks
The M5 and M15 time frames may have more false entry points.
Открыть график инструмента в новом окне