

Corak sebenar

Bullish Rectangle
was formed on 04.04 at 00:05:11 (UTC+0)
signal strength 1 of 5
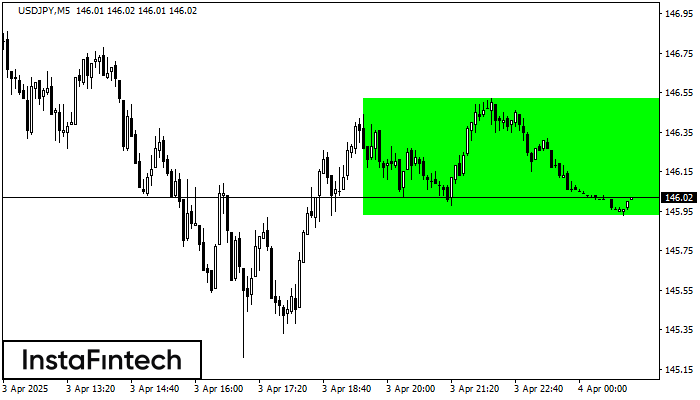
According to the chart of M5, USDJPY formed the Bullish Rectangle. This type of a pattern indicates a trend continuation. It consists of two levels: resistance 146.52 and support 145.93. In case the resistance level 146.52 - 146.52 is broken, the instrument is likely to follow the bullish trend.
The M5 and M15 time frames may have more false entry points.
- All
- All
- Bearish Rectangle
- Bearish Symmetrical Triangle
- Bearish Symmetrical Triangle
- Bullish Rectangle
- Double Top
- Double Top
- Triple Bottom
- Triple Bottom
- Triple Top
- Triple Top
- All
- All
- Buy
- Sale
- All
- 1
- 2
- 3
- 4
- 5
ডাবল বটম
was formed on 22.04 at 01:21:05 (UTC+0)
signal strength 1 of 5
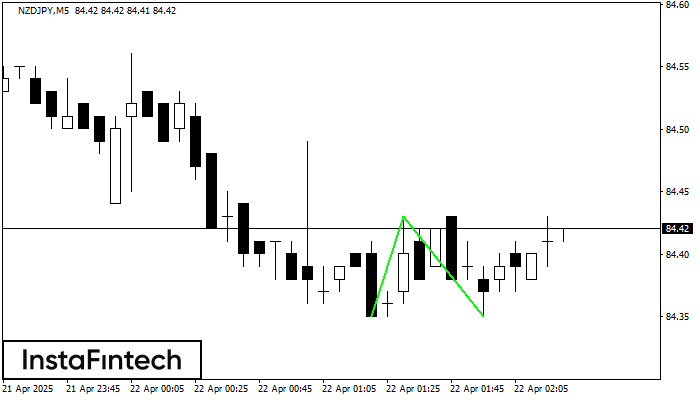
M5 চার্টে, NZDJPY-এর ডাবল বটম প্যাটার্নটি গঠিত হয়েছে। বৈশিষ্ট্য: সাপোর্ট স্তর হচ্ছে 84.35; রেজিস্ট্যান্স স্তর হচ্ছে 84.43; প্যাটার্নের প্রস্থ হচ্ছে 8 পয়েন্ট। রেজিস্ট্যান্স স্তর ভেদ করা হলে, 8 পয়েন্টের দূরত্বে
M5 এবং M15 টাইম ফ্রেমে আরও ভুল এন্ট্রি পয়েন্ট থাকতে পারে।
Open chart in a new window
ডাবল বটম
was formed on 22.04 at 01:06:45 (UTC+0)
signal strength 1 of 5
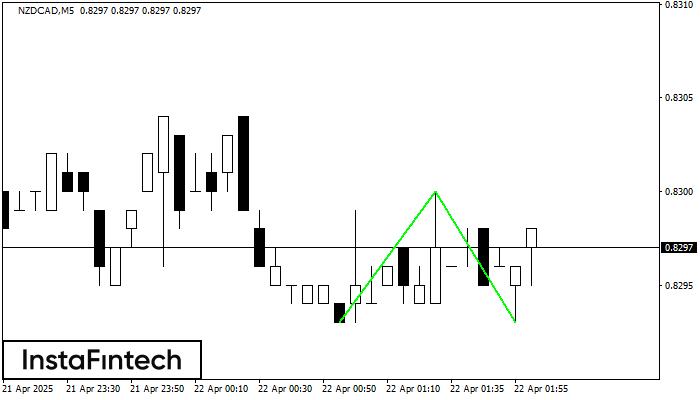
M5 চার্টে, NZDCAD-এর ডাবল বটম প্যাটার্নটি গঠিত হয়েছে। এই প্যাটার্নের গঠন এই সংকেত প্রদান করে যে মূল্য বিপরীতমুখী হয়ে নিম্নমুখী থেকে ঊর্ধ্বমুখী প্রবণতা প্রদর্শন করবে। এই প্যাটার্নের উপরের সীমানা 0.8300
M5 এবং M15 টাইম ফ্রেমে আরও ভুল এন্ট্রি পয়েন্ট থাকতে পারে।
Open chart in a new window
বুলিশ সিমেট্রিকাল ট্রায়াঙ্গেল
was formed on 22.04 at 00:32:37 (UTC+0)
signal strength 1 of 5

M5 চার্ট অনুযায়ী, GBPAUD বুলিশ সিমেট্রিকাল ট্রায়াঙ্গেল প্যাটার্ন গঠন করেছে। প্যাটার্নের নীচের সীমানা 2.0825/2.0852-এর কোঅর্ডিনেটগুলো স্পর্শ করেছে যেখানে উপরের সীমানাটি 2.0880/2.0852 জুড়ে যাচ্ছে৷ যদি বুলিশ সিমেট্রিকাল ট্রায়াঙ্গেল প্যাটার্নটি বজায় থাকে
M5 এবং M15 টাইম ফ্রেমে আরও ভুল এন্ট্রি পয়েন্ট থাকতে পারে।
Open chart in a new window


