

Corak sebenar

Bullish Rectangle
was formed on 03.04 at 04:04:22 (UTC+0)
signal strength 1 of 5
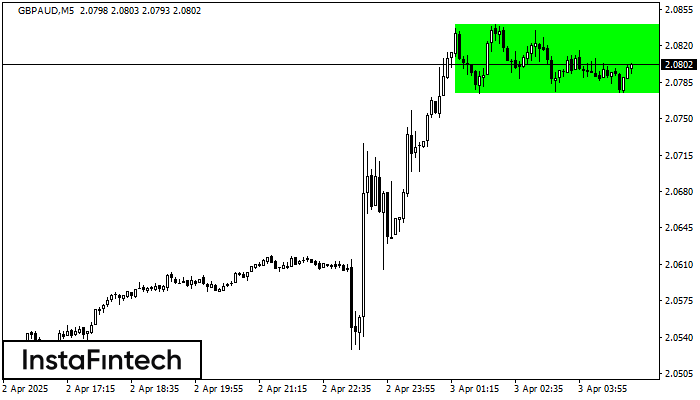
According to the chart of M5, GBPAUD formed the Bullish Rectangle. This type of a pattern indicates a trend continuation. It consists of two levels: resistance 2.0840 and support 2.0774. In case the resistance level 2.0840 - 2.0840 is broken, the instrument is likely to follow the bullish trend.
The M5 and M15 time frames may have more false entry points.
Juga lihat
- All
- All
- Bearish Rectangle
- Bearish Symmetrical Triangle
- Bearish Symmetrical Triangle
- Bullish Rectangle
- Double Top
- Double Top
- Triple Bottom
- Triple Bottom
- Triple Top
- Triple Top
- All
- All
- Buy
- Sale
- All
- 1
- 2
- 3
- 4
- 5
Double Bottom
was formed on 21.04 at 19:20:14 (UTC+0)
signal strength 1 of 5
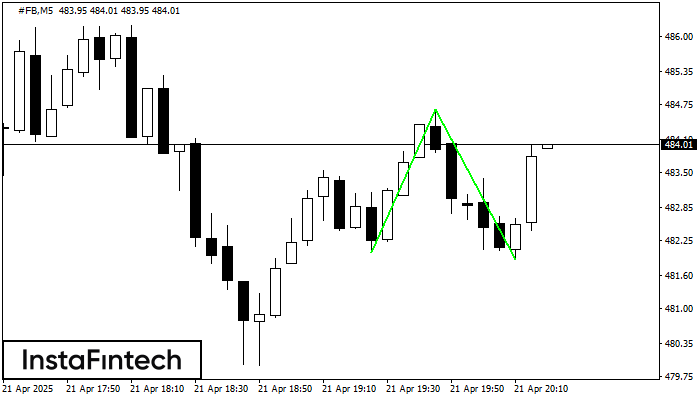
The Double Bottom pattern has been formed on #FB M5; the upper boundary is 484.65; the lower boundary is 481.90. The width of the pattern is 263 points. In case
The M5 and M15 time frames may have more false entry points.
Open chart in a new window
Triple Bottom
was formed on 21.04 at 19:00:13 (UTC+0)
signal strength 1 of 5
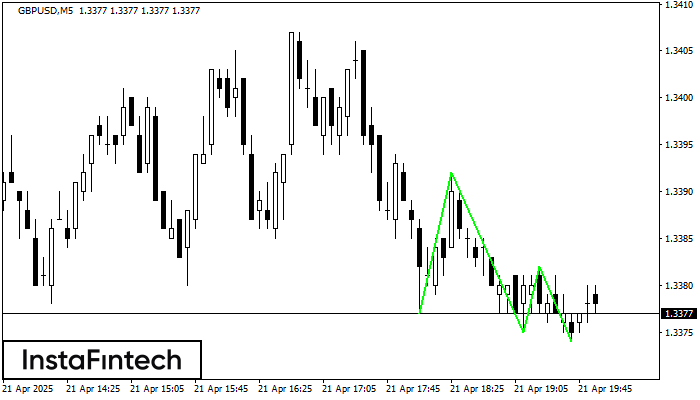
The Triple Bottom pattern has been formed on GBPUSD M5. It has the following characteristics: resistance level 1.3392/1.3382; support level 1.3377/1.3374; the width is 15 points. In the event
The M5 and M15 time frames may have more false entry points.
Open chart in a new window
Triple Bottom
was formed on 21.04 at 18:40:14 (UTC+0)
signal strength 1 of 5

The Triple Bottom pattern has formed on the chart of the #AMZN M5 trading instrument. The pattern signals a change in the trend from downwards to upwards in the case
The M5 and M15 time frames may have more false entry points.
Open chart in a new window


