

Corak sebenar

Triple Bottom
was formed on 02.04 at 20:40:09 (UTC+0)
signal strength 1 of 5
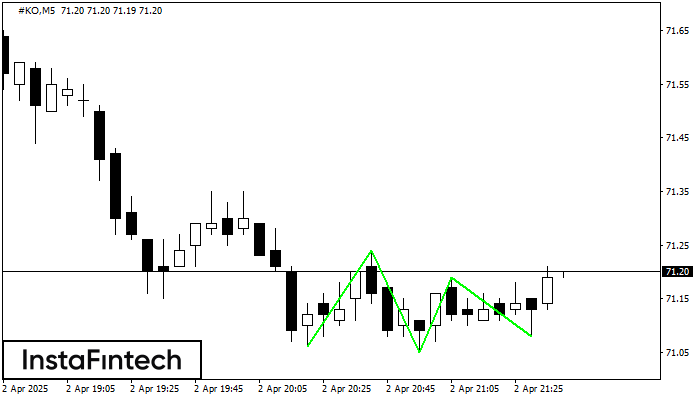
The Triple Bottom pattern has formed on the chart of #KO M5. Features of the pattern: The lower line of the pattern has coordinates 71.24 with the upper limit 71.24/71.19, the projection of the width is 18 points. The formation of the Triple Bottom pattern most likely indicates a change in the trend from downward to upward. This means that in the event of a breakdown of the resistance level 71.06, the price is most likely to continue the upward movement.
The M5 and M15 time frames may have more false entry points.
Juga lihat
- All
- All
- Bearish Rectangle
- Bearish Symmetrical Triangle
- Bearish Symmetrical Triangle
- Bullish Rectangle
- Double Top
- Double Top
- Triple Bottom
- Triple Bottom
- Triple Top
- Triple Top
- All
- All
- Buy
- Sale
- All
- 1
- 2
- 3
- 4
- 5
Double Bottom
was formed on 23.04 at 05:25:25 (UTC+0)
signal strength 1 of 5
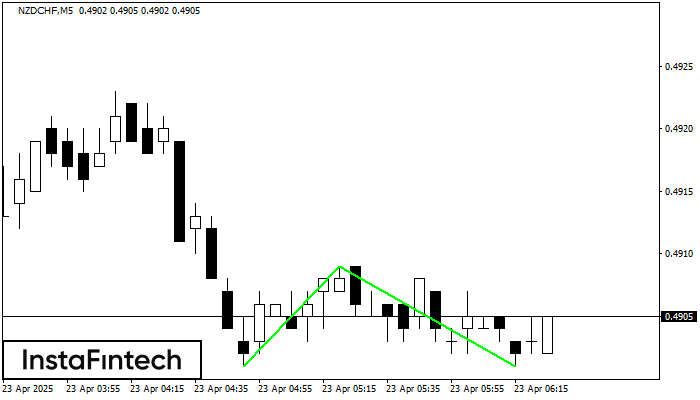
The Double Bottom pattern has been formed on NZDCHF M5. This formation signals a reversal of the trend from downwards to upwards. The signal is that a buy trade should
The M5 and M15 time frames may have more false entry points.
Open chart in a new window
Double Top
was formed on 23.04 at 05:25:23 (UTC+0)
signal strength 1 of 5
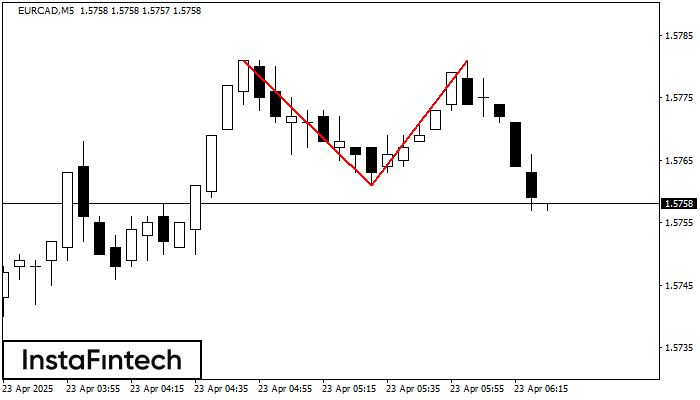
The Double Top pattern has been formed on EURCAD M5. It signals that the trend has been changed from upwards to downwards. Probably, if the base of the pattern 1.5761
The M5 and M15 time frames may have more false entry points.
Open chart in a new window
Double Top
was formed on 23.04 at 04:00:20 (UTC+0)
signal strength 2 of 5
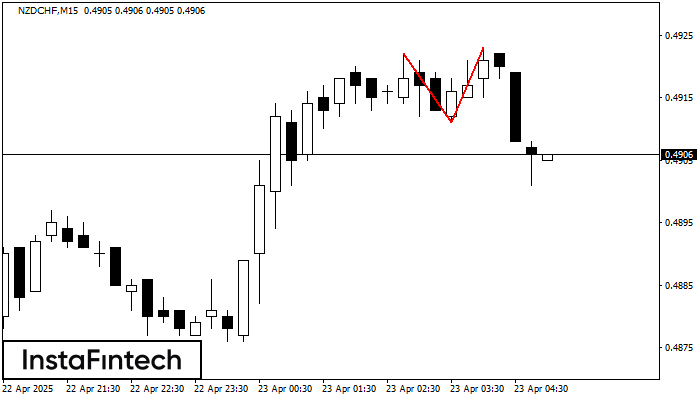
The Double Top pattern has been formed on NZDCHF M15. It signals that the trend has been changed from upwards to downwards. Probably, if the base of the pattern 0.4911
The M5 and M15 time frames may have more false entry points.
Open chart in a new window


