

Corak sebenar

Bearish Symmetrical Triangle
was formed on 02.04 at 15:16:29 (UTC+0)
signal strength 1 of 5
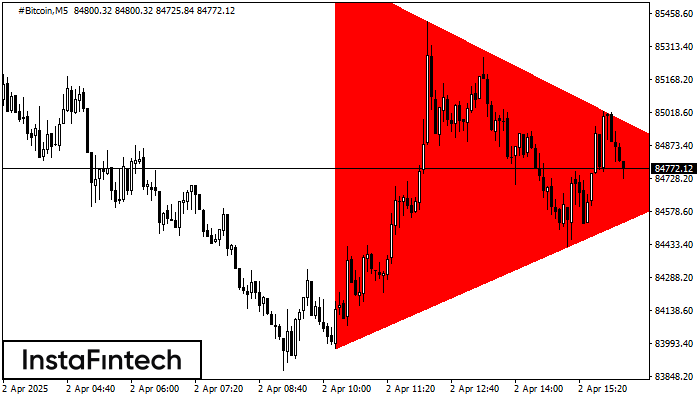
According to the chart of M5, #Bitcoin formed the Bearish Symmetrical Triangle pattern. This pattern signals a further downward trend in case the lower border 83970.22 is breached. Here, a hypothetical profit will equal the width of the available pattern that is -166370 pips.
The M5 and M15 time frames may have more false entry points.
- All
- All
- Bearish Rectangle
- Bearish Symmetrical Triangle
- Bearish Symmetrical Triangle
- Bullish Rectangle
- Double Top
- Double Top
- Triple Bottom
- Triple Bottom
- Triple Top
- Triple Top
- All
- All
- Buy
- Sale
- All
- 1
- 2
- 3
- 4
- 5
Triple Top
сформирован 16.04 в 20:00:08 (UTC+0)
сила сигнала 3 из 5

The Triple Top pattern has formed on the chart of the #MA M30. Features of the pattern: borders have an ascending angle; the lower line of the pattern
Открыть график инструмента в новом окне
Double Bottom
сформирован 16.04 в 19:45:07 (UTC+0)
сила сигнала 2 из 5
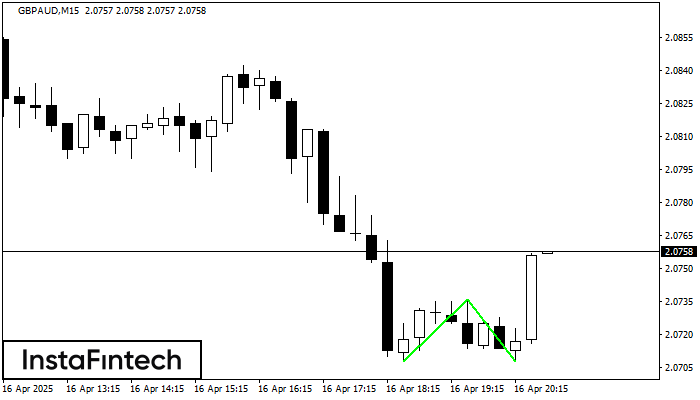
The Double Bottom pattern has been formed on GBPAUD M15; the upper boundary is 2.0736; the lower boundary is 2.0708. The width of the pattern is 28 points. In case
The M5 and M15 time frames may have more false entry points.
Открыть график инструмента в новом окне
Double Bottom
сформирован 16.04 в 19:30:25 (UTC+0)
сила сигнала 1 из 5
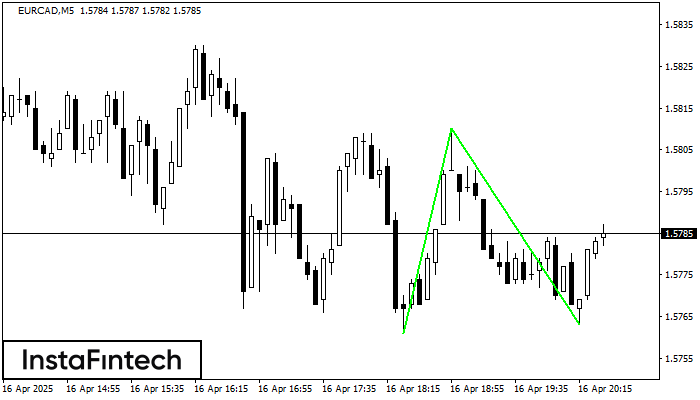
The Double Bottom pattern has been formed on EURCAD M5; the upper boundary is 1.5810; the lower boundary is 1.5763. The width of the pattern is 49 points. In case
The M5 and M15 time frames may have more false entry points.
Открыть график инструмента в новом окне


