

Corak sebenar

Bearish Symmetrical Triangle
was formed on 01.04 at 21:51:54 (UTC+0)
signal strength 1 of 5
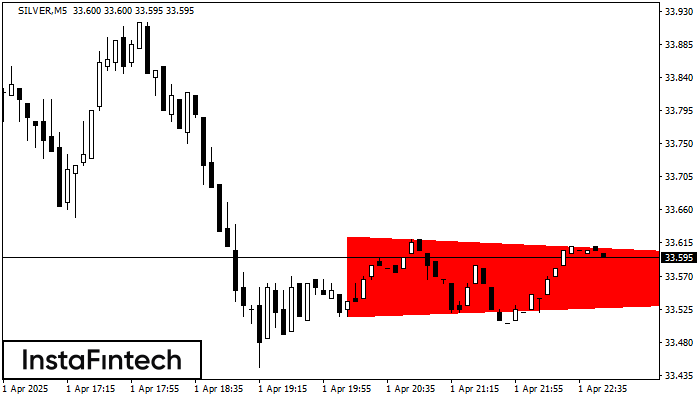
According to the chart of M5, SILVER formed the Bearish Symmetrical Triangle pattern. This pattern signals a further downward trend in case the lower border 33.52 is breached. Here, a hypothetical profit will equal the width of the available pattern that is -109 pips.
The M5 and M15 time frames may have more false entry points.
Juga lihat
- All
- All
- Bearish Rectangle
- Bearish Symmetrical Triangle
- Bearish Symmetrical Triangle
- Bullish Rectangle
- Double Top
- Double Top
- Triple Bottom
- Triple Bottom
- Triple Top
- Triple Top
- All
- All
- Buy
- Sale
- All
- 1
- 2
- 3
- 4
- 5
Double Bottom
was formed on 16.04 at 05:05:29 (UTC+0)
signal strength 1 of 5
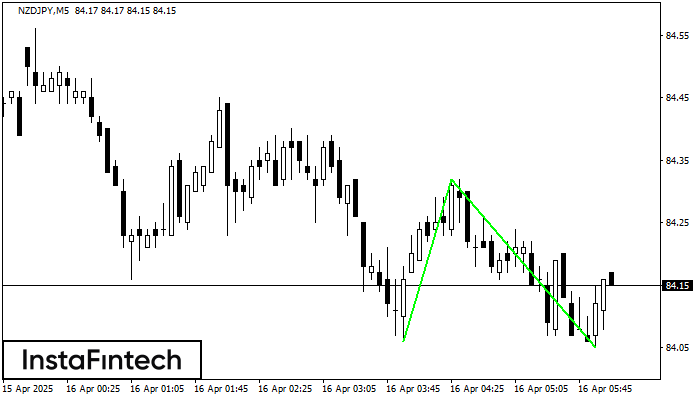
The Double Bottom pattern has been formed on NZDJPY M5. This formation signals a reversal of the trend from downwards to upwards. The signal is that a buy trade should
The M5 and M15 time frames may have more false entry points.
Open chart in a new window
Bearish Rectangle
was formed on 16.04 at 04:57:51 (UTC+0)
signal strength 1 of 5
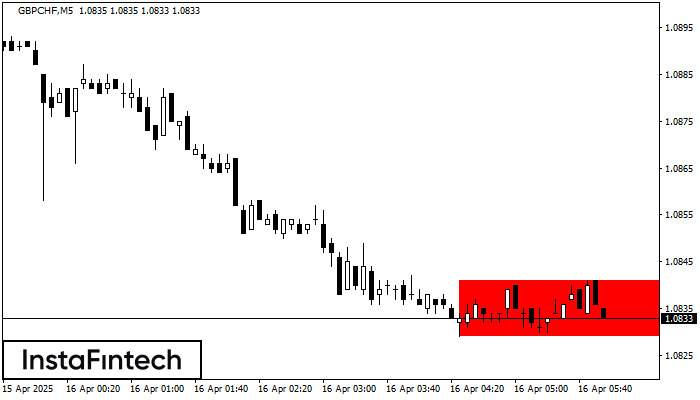
According to the chart of M5, GBPCHF formed the Bearish Rectangle. The pattern indicates a trend continuation. The upper border is 1.0841, the lower border is 1.0829. The signal means
The M5 and M15 time frames may have more false entry points.
Open chart in a new window
Triple Top
was formed on 16.04 at 04:45:18 (UTC+0)
signal strength 1 of 5
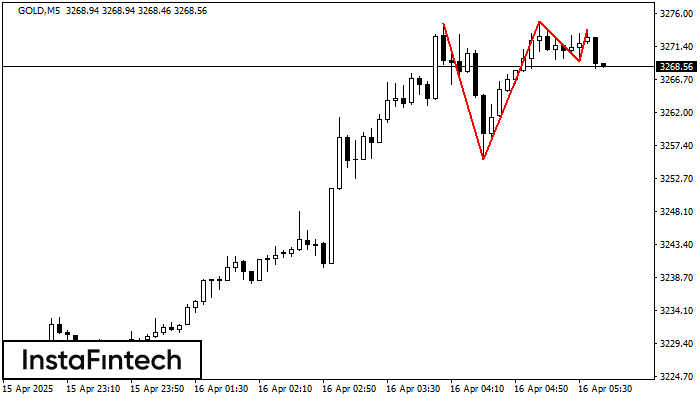
The Triple Top pattern has formed on the chart of the GOLD M5 trading instrument. It is a reversal pattern featuring the following characteristics: resistance level 87, support level -1386
The M5 and M15 time frames may have more false entry points.
Open chart in a new window


