

Corak sebenar

Triple Top
was formed on 01.04 at 00:15:38 (UTC+0)
signal strength 1 of 5
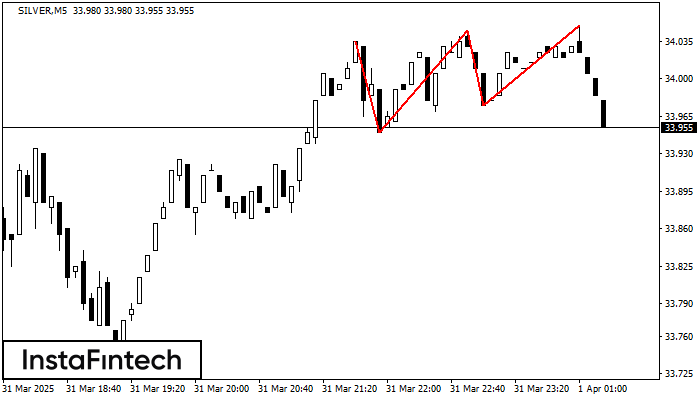
On the chart of the SILVER M5 trading instrument, the Triple Top pattern that signals a trend change has formed. It is possible that after formation of the third peak, the price will try to break through the resistance level 33.95, where we advise to open a trading position for sale. Take profit is the projection of the pattern’s width, which is 85 points.
The M5 and M15 time frames may have more false entry points.
Juga lihat
- All
- All
- Bearish Rectangle
- Bearish Symmetrical Triangle
- Bearish Symmetrical Triangle
- Bullish Rectangle
- Double Top
- Double Top
- Triple Bottom
- Triple Bottom
- Triple Top
- Triple Top
- All
- All
- Buy
- Sale
- All
- 1
- 2
- 3
- 4
- 5
Double Top
was formed on 21.04 at 22:26:30 (UTC+0)
signal strength 1 of 5

Corak pembalikan Double Top telah dibentuk pada AUDCAD M5. Ciri-ciri: sempadan atas %P0.000000; sempadan bawah 0.8880; sempadan bawah 0.8869; lebar corak adalah 11 mata. Dagangan menjual adalah lebih baik untuk
Carta masa M5 dan M15 mungkin mempunyai lebih banyak titik kemasukan palsu.
Open chart in a new window
Triple Bottom
was formed on 21.04 at 22:01:24 (UTC+0)
signal strength 3 of 5

Corak Triple Bottom telah dibentuk pada carta bagi instrumen dagangan USDJPY M30. Corak menandakan perubahan aliran dari menurun ke aliran menaik dalam sekiranya penembusan 141.08/141.05
Open chart in a new window
Double Bottom
was formed on 21.04 at 22:00:49 (UTC+0)
signal strength 4 of 5

Corak Double Bottom telah dibentuk pada AUDCHF H1; sempadan atas adalah 0.5198; sempadan bawah adalah 0.5165. Lebar corak adalah 34 mata. Sekiranya penembusan sempadan atas 0.5198, perubahan aliran boleh diramalkan
Open chart in a new window


