

Corak sebenar

Bearish Rectangle
was formed on 31.03 at 13:33:20 (UTC+0)
signal strength 2 of 5
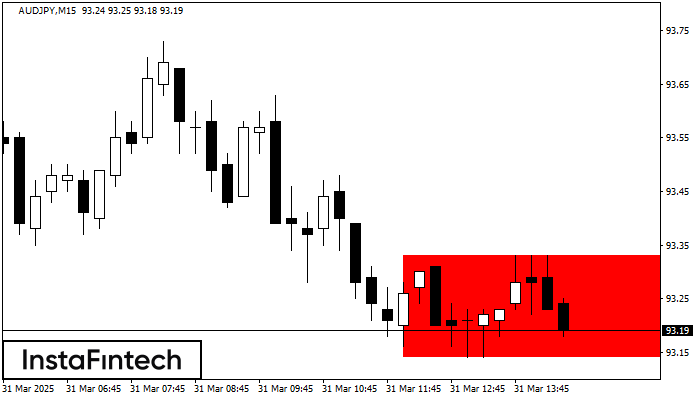
According to the chart of M15, AUDJPY formed the Bearish Rectangle. This type of a pattern indicates a trend continuation. It consists of two levels: resistance 93.33 - 0.00 and support 93.14 – 93.14. In case the resistance level 93.14 - 93.14 is broken, the instrument is likely to follow the bearish trend.
The M5 and M15 time frames may have more false entry points.
Juga lihat
- All
- All
- Bearish Rectangle
- Bearish Symmetrical Triangle
- Bearish Symmetrical Triangle
- Bullish Rectangle
- Double Top
- Double Top
- Triple Bottom
- Triple Bottom
- Triple Top
- Triple Top
- All
- All
- Buy
- Sale
- All
- 1
- 2
- 3
- 4
- 5
Triple Top
was formed on 23.04 at 19:15:20 (UTC+0)
signal strength 1 of 5
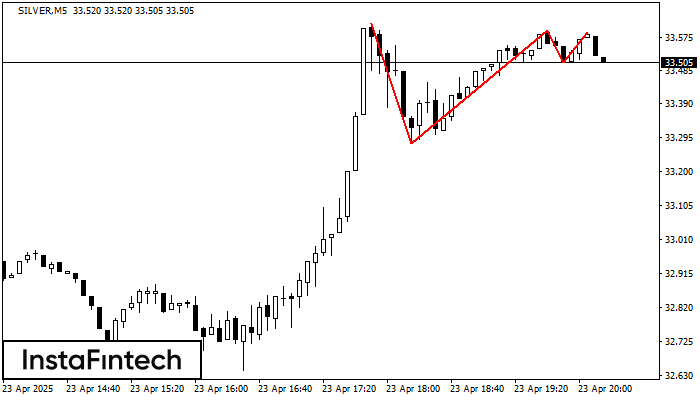
On the chart of the SILVER M5 trading instrument, the Triple Top pattern that signals a trend change has formed. It is possible that after formation of the third peak
The M5 and M15 time frames may have more false entry points.
Open chart in a new window
Double Bottom
was formed on 23.04 at 19:10:16 (UTC+0)
signal strength 1 of 5
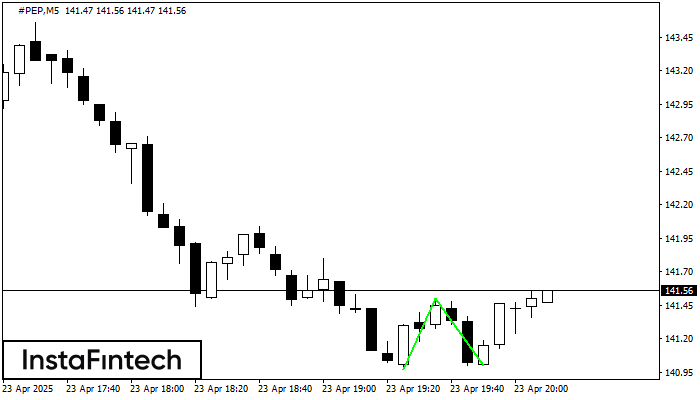
The Double Bottom pattern has been formed on #PEP M5. This formation signals a reversal of the trend from downwards to upwards. The signal is that a buy trade should
The M5 and M15 time frames may have more false entry points.
Open chart in a new window
Double Bottom
was formed on 23.04 at 19:10:15 (UTC+0)
signal strength 1 of 5

The Double Bottom pattern has been formed on #PEP M5. This formation signals a reversal of the trend from downwards to upwards. The signal is that a buy trade should
The M5 and M15 time frames may have more false entry points.
Open chart in a new window


