

Corak sebenar

Bullish Symmetrical Triangle
was formed on 31.03 at 11:25:28 (UTC+0)
signal strength 1 of 5
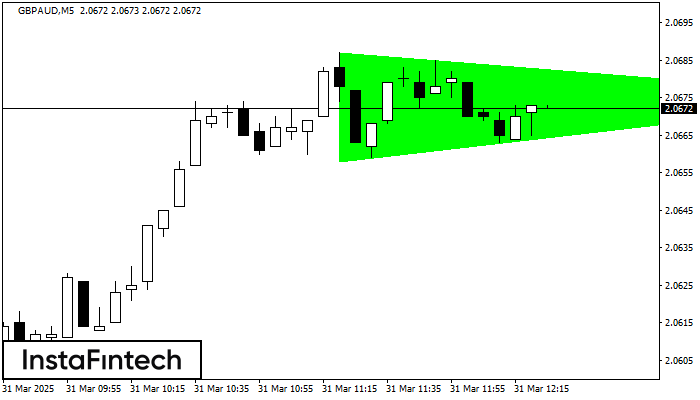
According to the chart of M5, GBPAUD formed the Bullish Symmetrical Triangle pattern. The lower border of the pattern touches the coordinates 2.0658/2.0675 whereas the upper border goes across 2.0687/2.0675. If the Bullish Symmetrical Triangle pattern is in progress, this evidently signals a further upward trend. In other words, in case the scenario comes true, the price of GBPAUD will breach the upper border to head for 2.0690.
The M5 and M15 time frames may have more false entry points.
Juga lihat
- All
- All
- Bearish Rectangle
- Bearish Symmetrical Triangle
- Bearish Symmetrical Triangle
- Bullish Rectangle
- Double Top
- Double Top
- Triple Bottom
- Triple Bottom
- Triple Top
- Triple Top
- All
- All
- Buy
- Sale
- All
- 1
- 2
- 3
- 4
- 5
Double Bottom
was formed on 22.04 at 15:30:30 (UTC+0)
signal strength 4 of 5
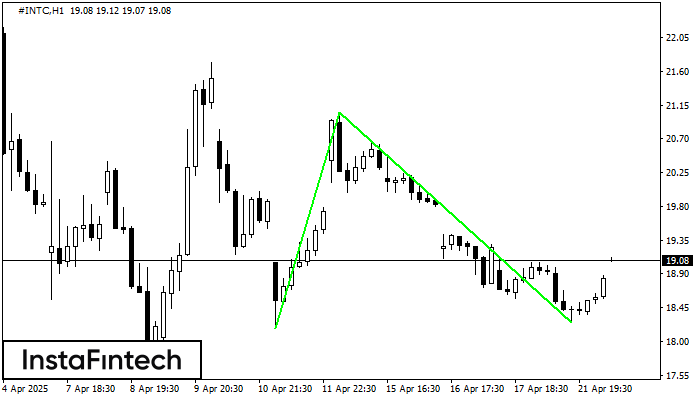
Corak Double Bottom telah dibentuk pada #INTC H1; sempadan atas adalah 21.05; sempadan bawah adalah 18.25. Lebar corak adalah 287 mata. Sekiranya penembusan sempadan atas 21.05, perubahan aliran boleh diramalkan
Open chart in a new window
Double Bottom
was formed on 22.04 at 14:06:13 (UTC+0)
signal strength 1 of 5

Corak Double Bottom telah dibentuk pada NZDCHF M5; sempadan atas adalah 0.4874; sempadan bawah adalah 0.4857. Lebar corak adalah 17 mata. Sekiranya penembusan sempadan atas 0.4874, perubahan aliran boleh diramalkan
Carta masa M5 dan M15 mungkin mempunyai lebih banyak titik kemasukan palsu.
Open chart in a new window
Double Bottom
was formed on 22.04 at 13:40:19 (UTC+0)
signal strength 1 of 5

Corak Double Bottom telah dibentuk pada GBPJPY M5. Ciri-ciri: tahap sokongan 187.44; tahap rintangan 187.65; lebar corak 21 mata. Sekiranya tahap rintangan ditembusi, perubahan aliran boleh diramalkan dengan titik sasaran
Carta masa M5 dan M15 mungkin mempunyai lebih banyak titik kemasukan palsu.
Open chart in a new window


