

Corak sebenar

Double Bottom
was formed on 31.03 at 05:35:10 (UTC+0)
signal strength 1 of 5

The Double Bottom pattern has been formed on USDJPY M5. Characteristics: the support level 148.74; the resistance level 148.96; the width of the pattern 22 points. If the resistance level is broken, a change in the trend can be predicted with the first target point lying at the distance of 21 points.
The M5 and M15 time frames may have more false entry points.
- All
- All
- Bearish Rectangle
- Bearish Symmetrical Triangle
- Bearish Symmetrical Triangle
- Bullish Rectangle
- Double Top
- Double Top
- Triple Bottom
- Triple Bottom
- Triple Top
- Triple Top
- All
- All
- Buy
- Sale
- All
- 1
- 2
- 3
- 4
- 5
Triple Bottom
сформирован 23.04 в 20:00:49 (UTC+0)
сила сигнала 1 из 5
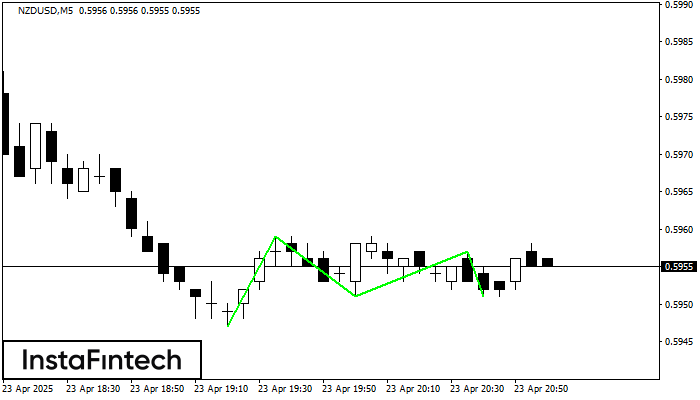
The Triple Bottom pattern has been formed on NZDUSD M5. It has the following characteristics: resistance level 0.5959/0.5957; support level 0.5947/0.5951; the width is 12 points. In the event
The M5 and M15 time frames may have more false entry points.
Открыть график инструмента в новом окне
Double Bottom
сформирован 23.04 в 20:00:30 (UTC+0)
сила сигнала 1 из 5
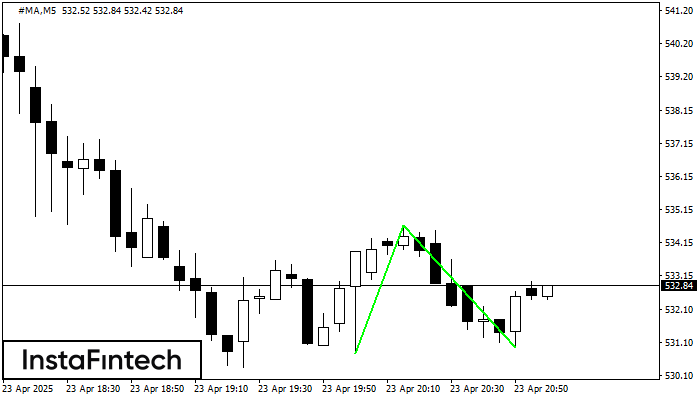
The Double Bottom pattern has been formed on #MA M5. This formation signals a reversal of the trend from downwards to upwards. The signal is that a buy trade should
The M5 and M15 time frames may have more false entry points.
Открыть график инструмента в новом окне
Bullish pennant
сформирован 23.04 в 20:00:19 (UTC+0)
сила сигнала 3 из 5
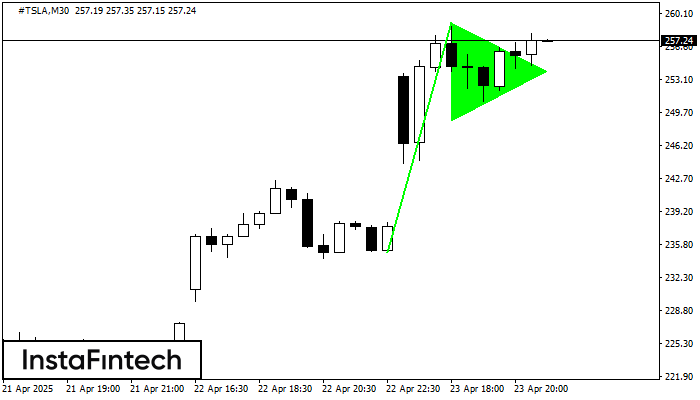
The Bullish pennant graphic pattern has formed on the #TSLA M30 instrument. This pattern type falls under the category of continuation patterns. In this case, if the quote can breaks
Открыть график инструмента в новом окне


