

Corak sebenar

Triple Top
was formed on 28.03 at 22:01:13 (UTC+0)
signal strength 1 of 5
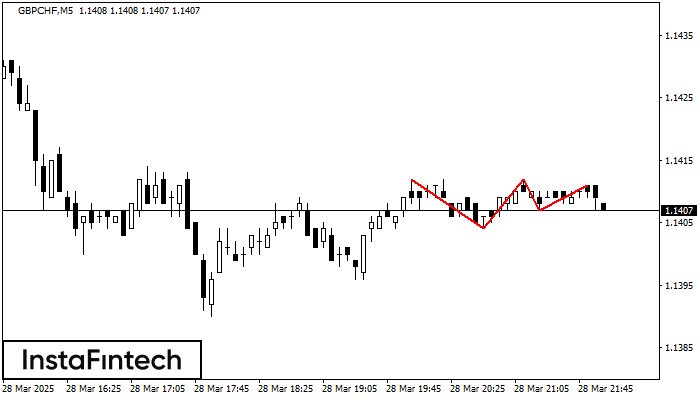
On the chart of the GBPCHF M5 trading instrument, the Triple Top pattern that signals a trend change has formed. It is possible that after formation of the third peak, the price will try to break through the resistance level 1.1404, where we advise to open a trading position for sale. Take profit is the projection of the pattern’s width, which is 8 points.
The M5 and M15 time frames may have more false entry points.
Juga lihat
- All
- All
- Bearish Rectangle
- Bearish Symmetrical Triangle
- Bearish Symmetrical Triangle
- Bullish Rectangle
- Double Top
- Double Top
- Triple Bottom
- Triple Bottom
- Triple Top
- Triple Top
- All
- All
- Buy
- Sale
- All
- 1
- 2
- 3
- 4
- 5
Double Top
was formed on 09.04 at 07:49:59 (UTC+0)
signal strength 1 of 5
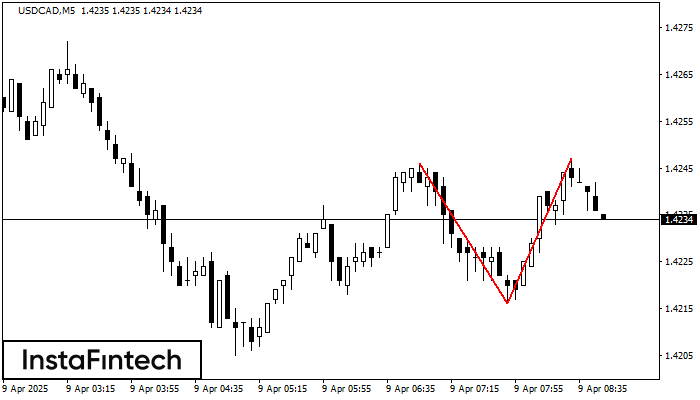
The Double Top pattern has been formed on USDCAD M5. It signals that the trend has been changed from upwards to downwards. Probably, if the base of the pattern 1.4216
The M5 and M15 time frames may have more false entry points.
Open chart in a new window
Bearish Symmetrical Triangle
was formed on 09.04 at 07:30:56 (UTC+0)
signal strength 1 of 5
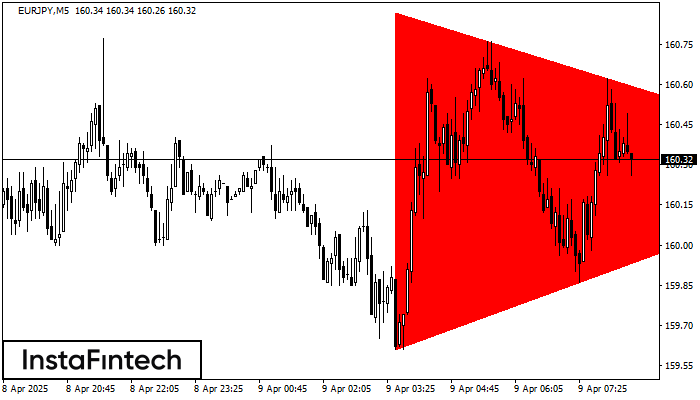
According to the chart of M5, EURJPY formed the Bearish Symmetrical Triangle pattern. This pattern signals a further downward trend in case the lower border 159.61 is breached. Here
The M5 and M15 time frames may have more false entry points.
Open chart in a new window
Bearish pennant
was formed on 09.04 at 07:17:26 (UTC+0)
signal strength 2 of 5
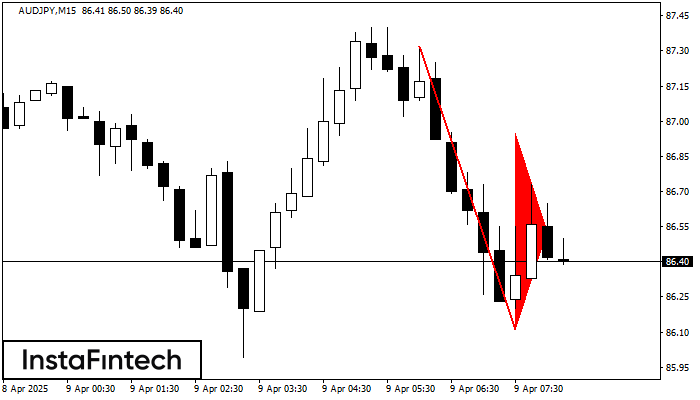
The Bearish pennant pattern has formed on the AUDJPY M15 chart. The pattern signals continuation of the downtrend in case the pennant’s low of 86.11 is broken through. Recommendations: Place
The M5 and M15 time frames may have more false entry points.
Open chart in a new window


