

Corak sebenar

Double Top
was formed on 28.03 at 15:30:06 (UTC+0)
signal strength 4 of 5
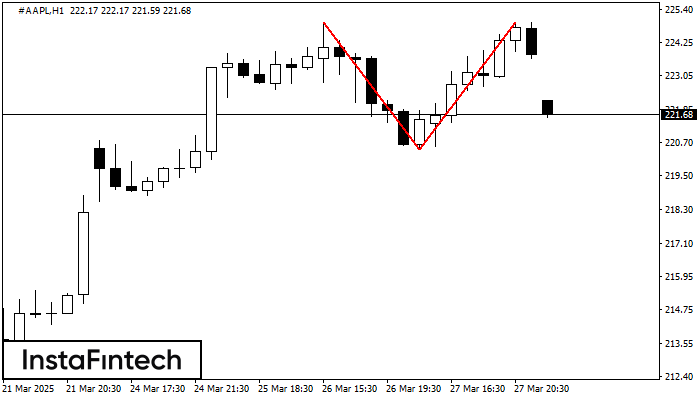
On the chart of #AAPL H1 the Double Top reversal pattern has been formed. Characteristics: the upper boundary 224.96; the lower boundary 220.45; the width of the pattern 451 points. The signal: a break of the lower boundary will cause continuation of the downward trend targeting the 220.05 level.
Juga lihat
- All
- All
- Bearish Rectangle
- Bearish Symmetrical Triangle
- Bearish Symmetrical Triangle
- Bullish Rectangle
- Double Top
- Double Top
- Triple Bottom
- Triple Bottom
- Triple Top
- Triple Top
- All
- All
- Buy
- Sale
- All
- 1
- 2
- 3
- 4
- 5
Double Bottom
was formed on 16.04 at 11:00:11 (UTC+0)
signal strength 3 of 5
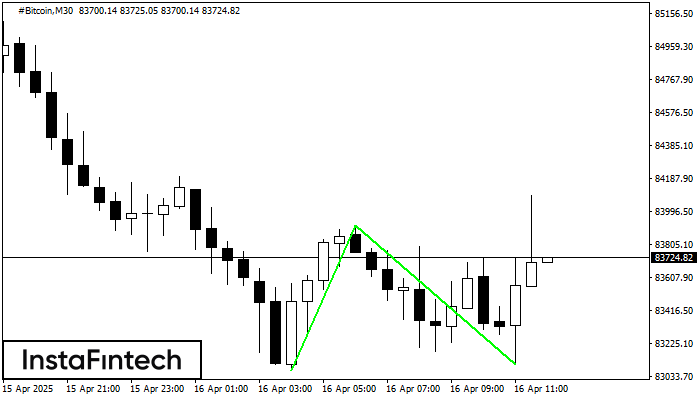
The Double Bottom pattern has been formed on #Bitcoin M30; the upper boundary is 83915.56; the lower boundary is 83100.24. The width of the pattern is 84817 points. In case
Open chart in a new window
Double Top
was formed on 16.04 at 10:45:17 (UTC+0)
signal strength 2 of 5
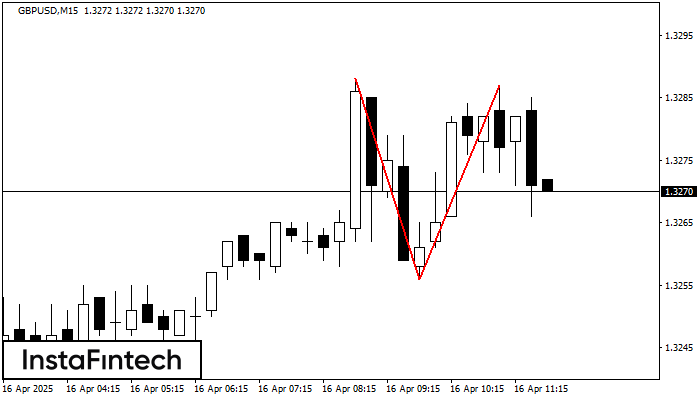
The Double Top reversal pattern has been formed on GBPUSD M15. Characteristics: the upper boundary 1.3288; the lower boundary 1.3256; the width of the pattern is 31 points. Sell trades
The M5 and M15 time frames may have more false entry points.
Open chart in a new window
Double Top
was formed on 16.04 at 10:30:11 (UTC+0)
signal strength 2 of 5
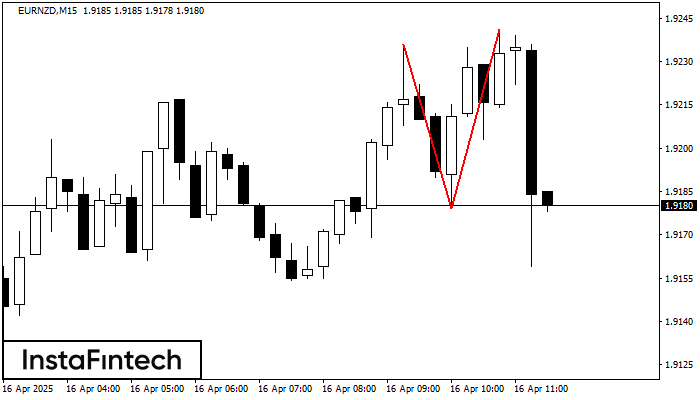
The Double Top reversal pattern has been formed on EURNZD M15. Characteristics: the upper boundary 1.9236; the lower boundary 1.9179; the width of the pattern is 62 points. Sell trades
The M5 and M15 time frames may have more false entry points.
Open chart in a new window


