

Corak sebenar

Triple Top
was formed on 28.03 at 14:10:07 (UTC+0)
signal strength 1 of 5
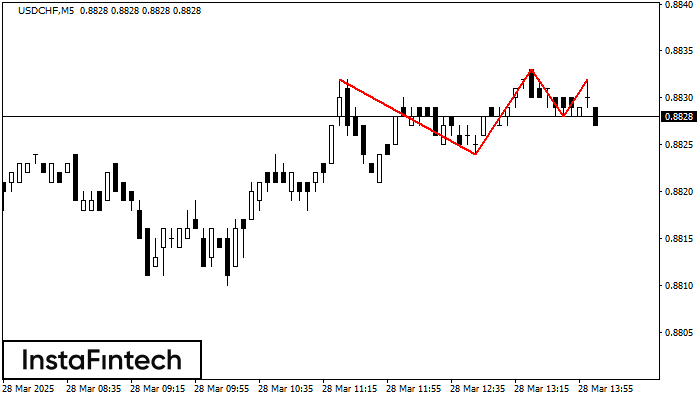
The Triple Top pattern has formed on the chart of the USDCHF M5. Features of the pattern: borders have an ascending angle; the lower line of the pattern has the coordinates 0.8824/0.8828 with the upper limit 0.8832/0.8832; the projection of the width is 8 points. The formation of the Triple Top figure most likely indicates a change in the trend from upward to downward. This means that in the event of a breakdown of the support level of 0.8824, the price is most likely to continue the downward movement.
The M5 and M15 time frames may have more false entry points.
- All
- All
- Bearish Rectangle
- Bearish Symmetrical Triangle
- Bearish Symmetrical Triangle
- Bullish Rectangle
- Double Top
- Double Top
- Triple Bottom
- Triple Bottom
- Triple Top
- Triple Top
- All
- All
- Buy
- Sale
- All
- 1
- 2
- 3
- 4
- 5
Bearish Symmetrical Triangle
was formed on 22.04 at 00:02:54 (UTC+0)
signal strength 2 of 5
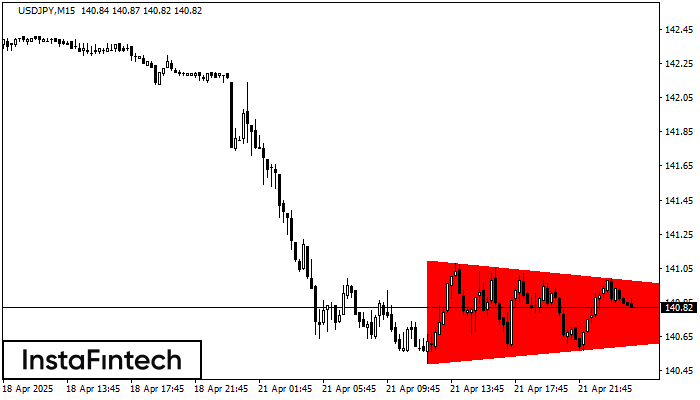
According to the chart of M15, USDJPY formed the Bearish Symmetrical Triangle pattern. Trading recommendations: A breach of the lower border 140.49 is likely to encourage a continuation
The M5 and M15 time frames may have more false entry points.
Open chart in a new window
Inverse Head and Shoulder
was formed on 22.04 at 00:00:27 (UTC+0)
signal strength 1 of 5

According to the chart of M5, AUDUSD produced the pattern termed the Inverse Head and Shoulder. The Head is fixed at 0.6402 while the median line of the Neck
The M5 and M15 time frames may have more false entry points.
Open chart in a new window
Bearish Symmetrical Triangle
was formed on 21.04 at 23:42:32 (UTC+0)
signal strength 3 of 5

According to the chart of M30, NZDJPY formed the Bearish Symmetrical Triangle pattern. Description: The lower border is 83.98/84.43 and upper border is 84.90/84.43. The pattern width is measured
Open chart in a new window


