

Corak sebenar

Head and Shoulders
was formed on 25.03 at 04:15:36 (UTC+0)
signal strength 1 of 5

According to the chart of M5, USDJPY formed the Head and Shoulders pattern. The Head’s top is set at 150.87 while the median line of the Neck is found at 150.68/150.70. The formation of the Head and Shoulders pattern evidently signals a reversal of the upward trend. In other words, in case the scenario comes true, the price of USDJPY will go towards 150.55.
The M5 and M15 time frames may have more false entry points.
- All
- All
- Bearish Rectangle
- Bearish Symmetrical Triangle
- Bearish Symmetrical Triangle
- Bullish Rectangle
- Double Top
- Double Top
- Triple Bottom
- Triple Bottom
- Triple Top
- Triple Top
- All
- All
- Buy
- Sale
- All
- 1
- 2
- 3
- 4
- 5
Double Top
was formed on 31.03 at 10:30:55 (UTC+0)
signal strength 3 of 5
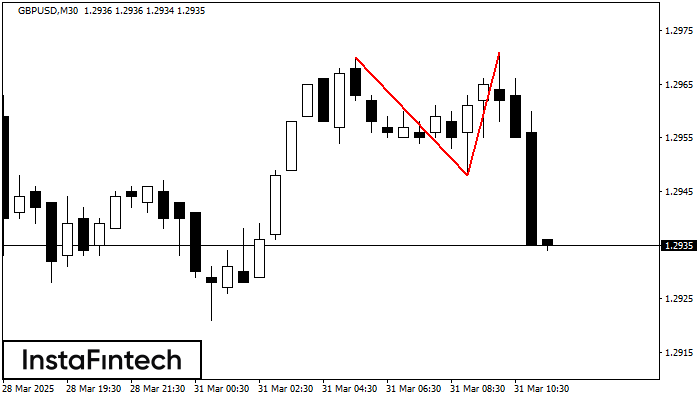
Corak pembalikan Double Top telah dibentuk pada GBPUSD M30. Ciri-ciri: sempadan atas %P0.000000; sempadan bawah 1.2970; sempadan bawah 1.2948; lebar corak adalah 23 mata. Dagangan menjual adalah lebih baik untuk
Open chart in a new window
Triple Top
was formed on 31.03 at 10:00:28 (UTC+0)
signal strength 3 of 5

Pada carta instrumen dagangan EURUSD M30, corak Triple Top yang menandakan perubahan aliran telah terbentuk. Adalah mungkin bahawa selepas pembentukan bahagian atas ketiga, harga akan cuba menembusi tahap rintangan 1.0805
Open chart in a new window
Double Bottom
was formed on 31.03 at 10:00:26 (UTC+0)
signal strength 3 of 5

Corak Double Bottom telah dibentuk pada USDJPY M30. Pembentukan ini menandakan pembalikan aliran dari aliran menurun ke atas. Isyarat ialah perdagangan membeli harus dibuka selepas sempadan atas corak 149.26 telah
Open chart in a new window

