

Corak sebenar

Triple Top
was formed on 25.03 at 03:55:23 (UTC+0)
signal strength 1 of 5
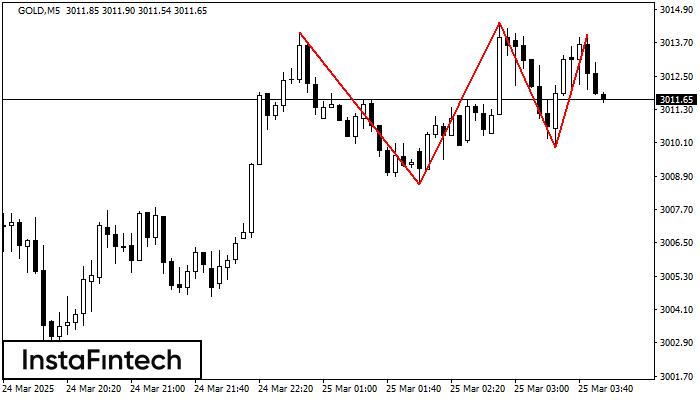
On the chart of the GOLD M5 trading instrument, the Triple Top pattern that signals a trend change has formed. It is possible that after formation of the third peak, the price will try to break through the resistance level 3008.62, where we advise to open a trading position for sale. Take profit is the projection of the pattern’s width, which is 544 points.
The M5 and M15 time frames may have more false entry points.
Juga lihat
- All
- All
- Bearish Rectangle
- Bearish Symmetrical Triangle
- Bearish Symmetrical Triangle
- Bullish Rectangle
- Double Top
- Double Top
- Triple Bottom
- Triple Bottom
- Triple Top
- Triple Top
- All
- All
- Buy
- Sale
- All
- 1
- 2
- 3
- 4
- 5
Triple Top
was formed on 31.03 at 10:00:28 (UTC+0)
signal strength 3 of 5

Pada carta instrumen dagangan EURUSD M30, corak Triple Top yang menandakan perubahan aliran telah terbentuk. Adalah mungkin bahawa selepas pembentukan bahagian atas ketiga, harga akan cuba menembusi tahap rintangan 1.0805
Open chart in a new window
Double Bottom
was formed on 31.03 at 10:00:26 (UTC+0)
signal strength 3 of 5

Corak Double Bottom telah dibentuk pada USDJPY M30. Pembentukan ini menandakan pembalikan aliran dari aliran menurun ke atas. Isyarat ialah perdagangan membeli harus dibuka selepas sempadan atas corak 149.26 telah
Open chart in a new window
Double Bottom
was formed on 31.03 at 10:00:23 (UTC+0)
signal strength 3 of 5
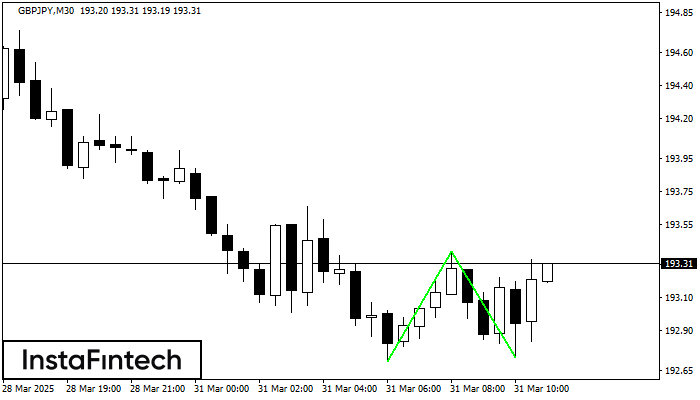
Corak Double Bottom telah dibentuk pada GBPJPY M30. Pembentukan ini menandakan pembalikan aliran dari aliran menurun ke atas. Isyarat ialah perdagangan membeli harus dibuka selepas sempadan atas corak 193.38 telah
Open chart in a new window


