

Corak sebenar

Bearish Flag
was formed on 24.03 at 19:35:18 (UTC+0)
signal strength 1 of 5

The Bearish Flag pattern has been formed on the chart #INTC M5. Therefore, the downwards trend is likely to continue in the nearest term. As soon as the price breaks below the low at 24.13, traders should enter the market.
The M5 and M15 time frames may have more false entry points.
Juga lihat
- All
- All
- Bearish Rectangle
- Bearish Symmetrical Triangle
- Bearish Symmetrical Triangle
- Bullish Rectangle
- Double Top
- Double Top
- Triple Bottom
- Triple Bottom
- Triple Top
- Triple Top
- All
- All
- Buy
- Sale
- All
- 1
- 2
- 3
- 4
- 5
Double Top
was formed on 31.03 at 15:00:07 (UTC+0)
signal strength 4 of 5
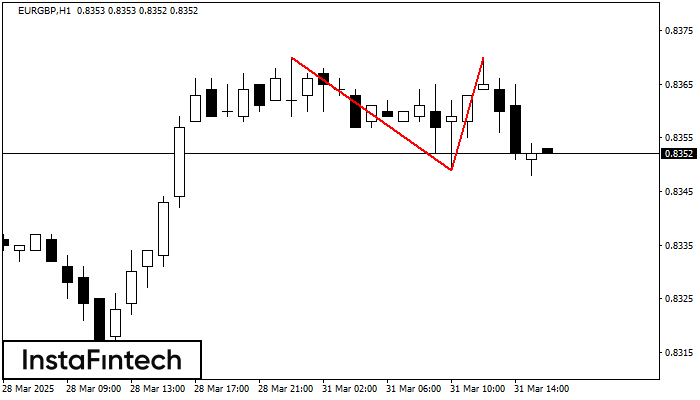
On the chart of EURGBP H1 the Double Top reversal pattern has been formed. Characteristics: the upper boundary 0.8370; the lower boundary 0.8349; the width of the pattern 21 points
Open chart in a new window
Double Bottom
was formed on 31.03 at 14:45:14 (UTC+0)
signal strength 2 of 5
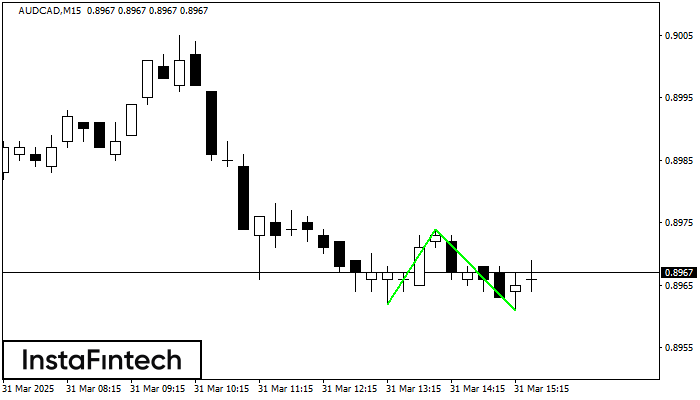
The Double Bottom pattern has been formed on AUDCAD M15. Characteristics: the support level 0.8962; the resistance level 0.8974; the width of the pattern 12 points. If the resistance level
The M5 and M15 time frames may have more false entry points.
Open chart in a new window
Bullish Rectangle
was formed on 31.03 at 14:32:37 (UTC+0)
signal strength 1 of 5

According to the chart of M5, #Bitcoin formed the Bullish Rectangle which is a pattern of a trend continuation. The pattern is contained within the following borders: the lower border
The M5 and M15 time frames may have more false entry points.
Open chart in a new window


