

Corak sebenar

Double Bottom
was formed on 24.03 at 19:06:44 (UTC+0)
signal strength 1 of 5
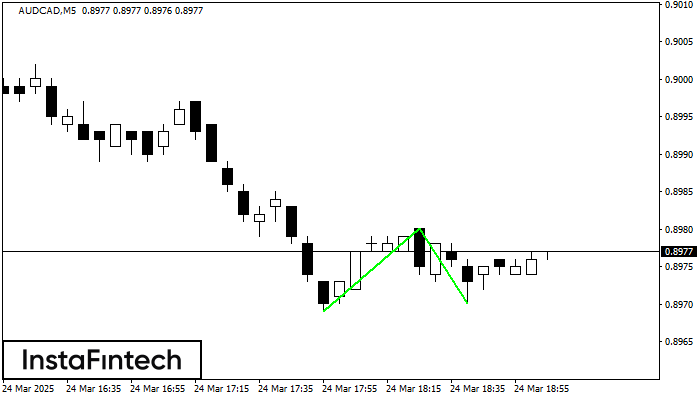
The Double Bottom pattern has been formed on AUDCAD M5; the upper boundary is 0.8980; the lower boundary is 0.8970. The width of the pattern is 11 points. In case of a break of the upper boundary 0.8980, a change in the trend can be predicted where the width of the pattern will coincide with the distance to a possible take profit level.
The M5 and M15 time frames may have more false entry points.
- All
- All
- Bearish Rectangle
- Bearish Symmetrical Triangle
- Bearish Symmetrical Triangle
- Bullish Rectangle
- Double Top
- Double Top
- Triple Bottom
- Triple Bottom
- Triple Top
- Triple Top
- All
- All
- Buy
- Sale
- All
- 1
- 2
- 3
- 4
- 5
Double Bottom
was formed on 31.03 at 13:01:22 (UTC+0)
signal strength 3 of 5
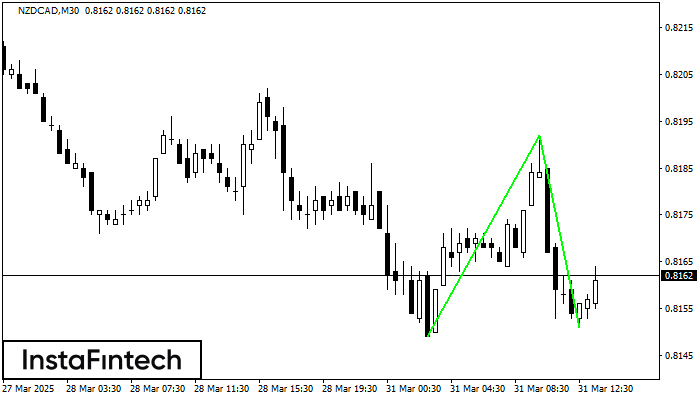
Corak Double Bottom telah dibentuk pada NZDCAD M30. Ciri-ciri: tahap sokongan 0.8149; tahap rintangan 0.8192; lebar corak 43 mata. Sekiranya tahap rintangan ditembusi, perubahan aliran boleh diramalkan dengan titik sasaran
Open chart in a new window
Triple Bottom
was formed on 31.03 at 13:00:03 (UTC+0)
signal strength 3 of 5
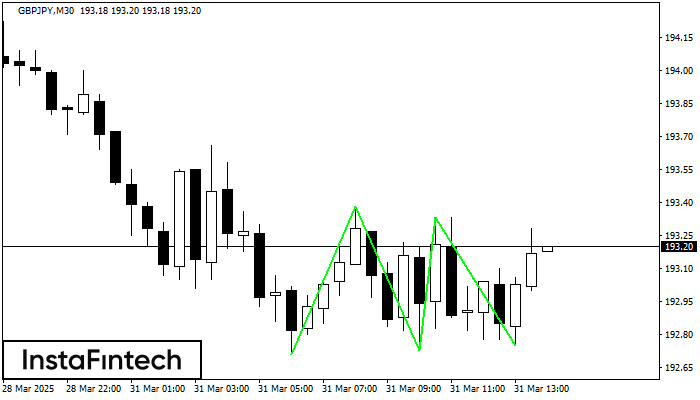
Corak Triple Bottom telah dibentuk pada GBPJPY M30. Ia mempunyai ciri-ciri berikut: tahap rintangan 193.38/193.33; tahap sokongan 192.71/192.75; lebar corak adalah 67 mata. Dalam situasi penembusan paras rintangan 193.38, harga
Open chart in a new window
Triple Bottom
was formed on 31.03 at 12:45:37 (UTC+0)
signal strength 2 of 5
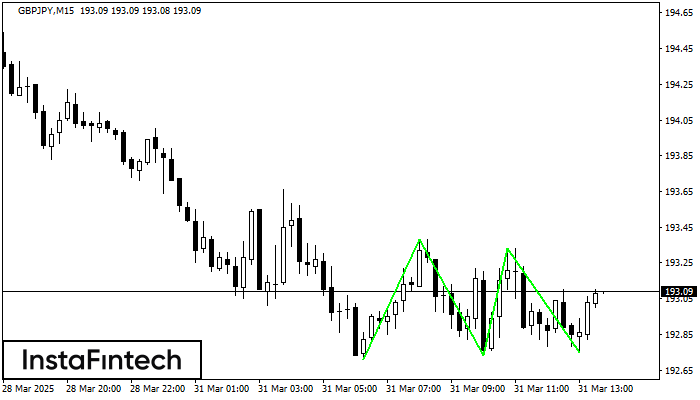
Corak Triple Bottom telah dibentuk pada carta bagi instrumen dagangan GBPJPY M15. Corak menandakan perubahan aliran dari menurun ke aliran menaik dalam sekiranya penembusan 193.38/193.33
Carta masa M5 dan M15 mungkin mempunyai lebih banyak titik kemasukan palsu.
Open chart in a new window

