

Corak sebenar

Bearish Rectangle
was formed on 21.03 at 21:46:26 (UTC+0)
signal strength 1 of 5

According to the chart of M5, USDCAD formed the Bearish Rectangle which is a pattern of a trend continuation. The pattern is contained within the following borders: lower border 1.4338 – 1.4338 and upper border 1.4351 – 1.4351. In case the lower border is broken, the instrument is likely to follow the downward trend.
The M5 and M15 time frames may have more false entry points.
Juga lihat
- All
- All
- Bearish Rectangle
- Bearish Symmetrical Triangle
- Bearish Symmetrical Triangle
- Bullish Rectangle
- Double Top
- Double Top
- Triple Bottom
- Triple Bottom
- Triple Top
- Triple Top
- All
- All
- Buy
- Sale
- All
- 1
- 2
- 3
- 4
- 5
Inverse Head dan Shoulder
was formed on 28.03 at 11:39:48 (UTC+0)
signal strength 1 of 5
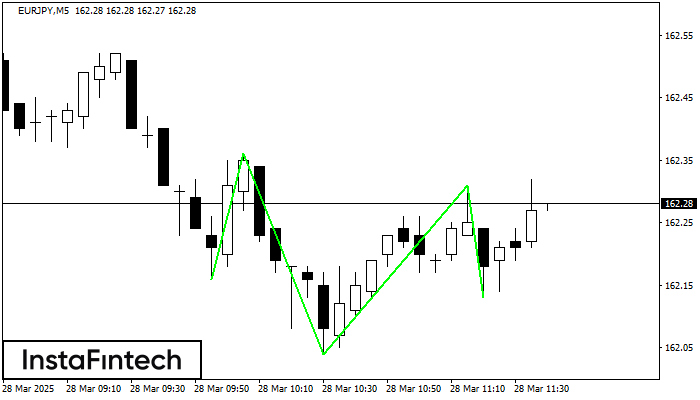
According to M5, EURJPY is shaping the technical pattern – the Inverse Head dan Shoulder. In case the Neckline 162.36/162.31 is broken out, the instrument is likely to move toward
Carta masa M5 dan M15 mungkin mempunyai lebih banyak titik kemasukan palsu.
Open chart in a new window
Double Top
was formed on 28.03 at 11:04:46 (UTC+0)
signal strength 1 of 5
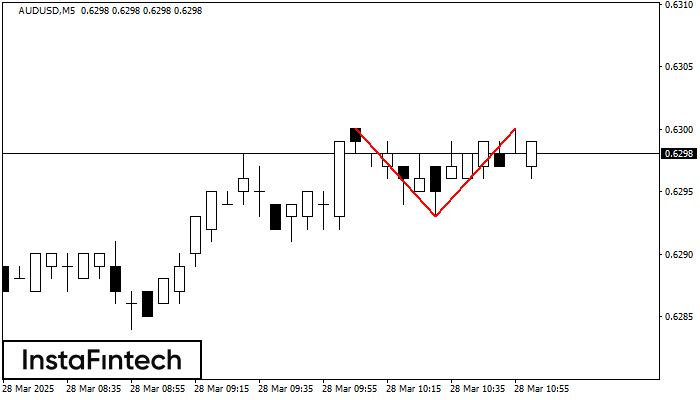
Corak Double Top telah dibentuk pada AUDUSD M5. Isyarat bahawa aliran telah berubah dari aliran menaik ke aliran menurun. Mungkin, sekiranya asas corak 0.6293 ditembusi, pergerakan menurun akan berterusan
Carta masa M5 dan M15 mungkin mempunyai lebih banyak titik kemasukan palsu.
Open chart in a new window
Double Top
was formed on 28.03 at 10:30:00 (UTC+0)
signal strength 3 of 5
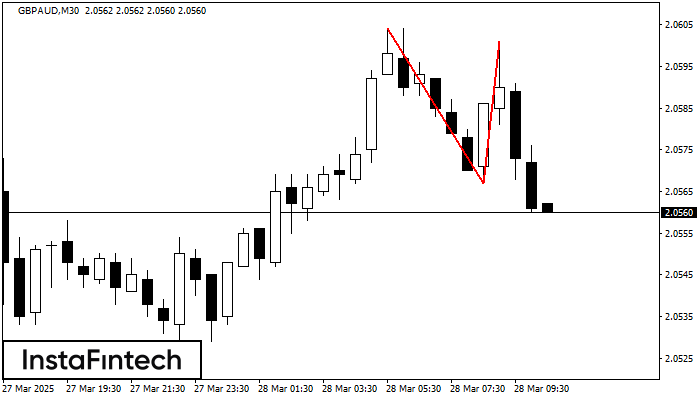
Pada carta GBPAUD M30 corak pembalikan Double Top telah terbentuk. Ciri-ciri: sempadan atas 2.0601; sempadan bawah 2.0567; lebar corak 34 mata. Isyarat: penembusan sempadan bawah akan menyebabkan kesinambungan arah aliran
Open chart in a new window


