

Өзекті паттерндер

Прямоугольник
сформирован 04.04 в 04:21:33 (UTC+0)
сила сигнала 2 из 5
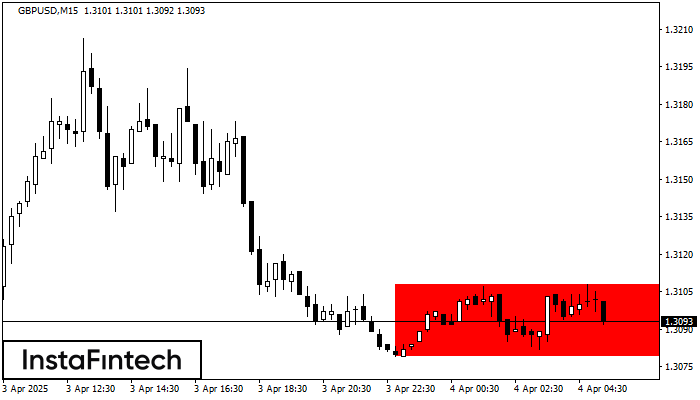
Сформирована фигура «Прямоугольник» на графике GBPUSD M15. Тип фигуры: Продолжение тренда; Границы: Верхняя 1.3108, Нижняя 1.3079; Сигнал: позиция на продажу открывается после фиксации цены ниже границы прямоугольника 1.3079.
Таймфреймы М5 и М15 могут иметь больше ложных точек входа.
- Все
- Все
- Bearish Rectangle
- Bearish Symmetrical Triangle
- Bearish Symmetrical Triangle
- Bullish Rectangle
- Double Top
- Double Top
- Triple Bottom
- Triple Bottom
- Triple Top
- Triple Top
- Все
- Все
- Покупка
- Продажа
- Все
- 1
- 2
- 3
- 4
- 5
Bullish Symmetrical Triangle
сформирован 23.04 в 11:41:41 (UTC+0)
сила сигнала 2 из 5

According to the chart of M15, NZDJPY formed the Bullish Symmetrical Triangle pattern. Description: This is the pattern of a trend continuation. 85.15 and 84.50 are the coordinates
The M5 and M15 time frames may have more false entry points.
Открыть график инструмента в новом окне
Double Top
сформирован 23.04 в 11:40:40 (UTC+0)
сила сигнала 1 из 5
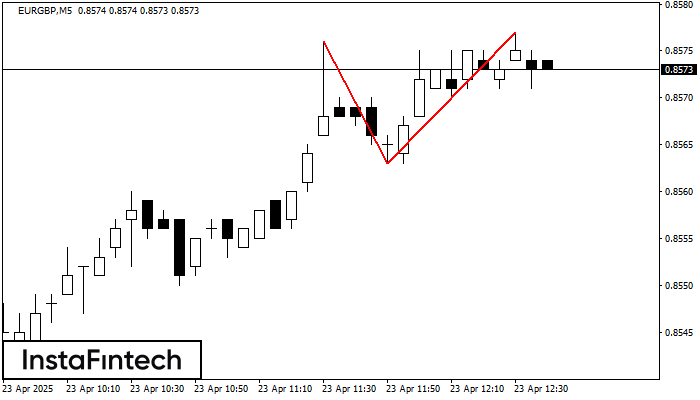
On the chart of EURGBP M5 the Double Top reversal pattern has been formed. Characteristics: the upper boundary 0.8577; the lower boundary 0.8563; the width of the pattern 14 points
The M5 and M15 time frames may have more false entry points.
Открыть график инструмента в новом окне
Double Top
сформирован 23.04 в 11:40:18 (UTC+0)
сила сигнала 1 из 5

On the chart of EURNZD M5 the Double Top reversal pattern has been formed. Characteristics: the upper boundary 1.9084; the lower boundary 1.9056; the width of the pattern 28 points
The M5 and M15 time frames may have more false entry points.
Открыть график инструмента в новом окне


