

Өзекті паттерндер

Прямоугольник
сформирован 02.04 в 14:48:39 (UTC+0)
сила сигнала 1 из 5
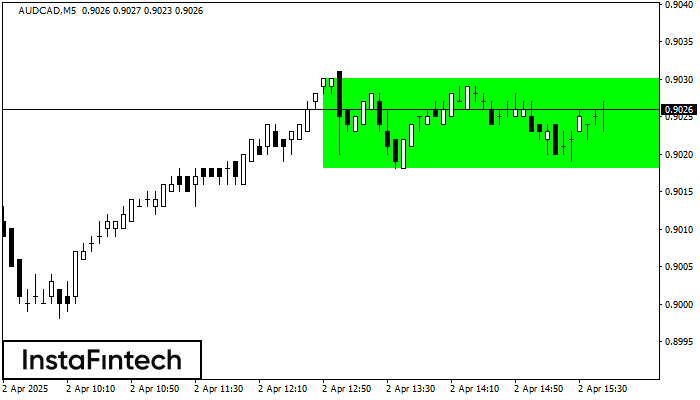
По торговому инструменту AUDCAD на M5 сформировалась фигура продолжения тренда - «Прямоугольник». Фигура имеет границы: Нижняя 0.9018; Верхняя 0.9030. В случае пробоя верхней границы вероятно дальнейшее движение в сторону тренда.
Таймфреймы М5 и М15 могут иметь больше ложных точек входа.
- Все
- Все
- Bearish Rectangle
- Bearish Symmetrical Triangle
- Bearish Symmetrical Triangle
- Bullish Rectangle
- Double Top
- Double Top
- Triple Bottom
- Triple Bottom
- Triple Top
- Triple Top
- Все
- Все
- Покупка
- Продажа
- Все
- 1
- 2
- 3
- 4
- 5
Double Top
was formed on 23.04 at 20:45:15 (UTC+0)
signal strength 1 of 5
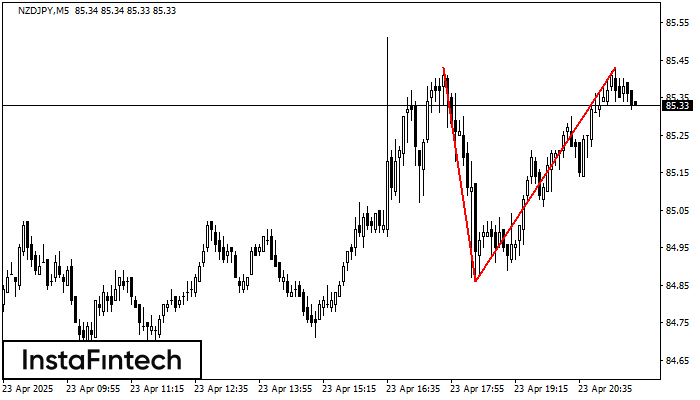
On the chart of NZDJPY M5 the Double Top reversal pattern has been formed. Characteristics: the upper boundary 85.43; the lower boundary 84.86; the width of the pattern 57 points
The M5 and M15 time frames may have more false entry points.
Open chart in a new window
Triple Bottom
was formed on 23.04 at 20:00:49 (UTC+0)
signal strength 1 of 5
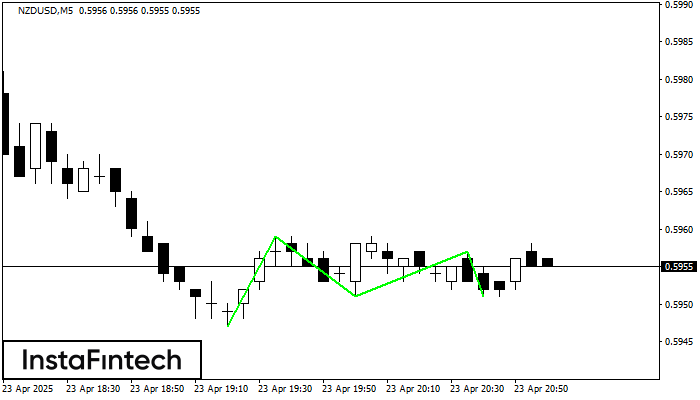
The Triple Bottom pattern has been formed on NZDUSD M5. It has the following characteristics: resistance level 0.5959/0.5957; support level 0.5947/0.5951; the width is 12 points. In the event
The M5 and M15 time frames may have more false entry points.
Open chart in a new window
Double Bottom
was formed on 23.04 at 20:00:30 (UTC+0)
signal strength 1 of 5
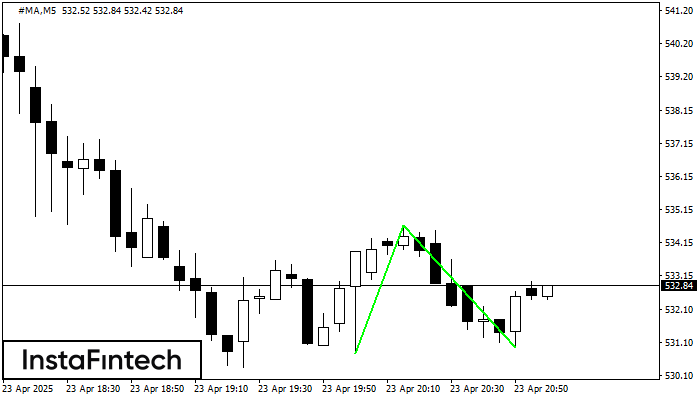
The Double Bottom pattern has been formed on #MA M5. This formation signals a reversal of the trend from downwards to upwards. The signal is that a buy trade should
The M5 and M15 time frames may have more false entry points.
Open chart in a new window


