

Өзекті паттерндер

Двойное дно
сформирован 02.04 в 10:15:42 (UTC+0)
сила сигнала 2 из 5
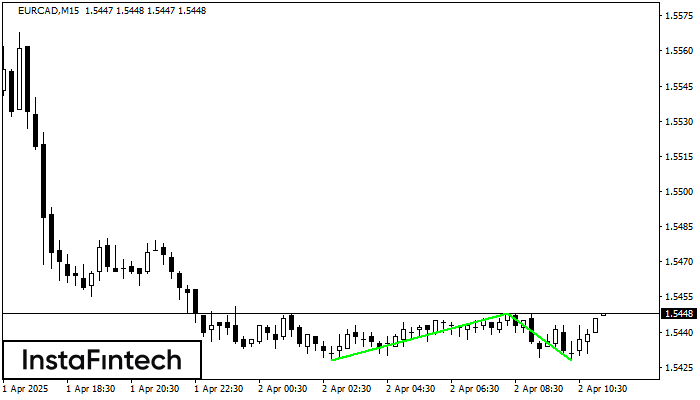
Сформирована фигура «Двойное дно» на графике EURCAD M15. Данное формирование сигнализирует об изменении тенденции с нисходящего на восходящее движение. Сигнал: Торговую позицию на покупку следует открывать после пробоя верхней границы фигуры 1.5448, где перспектива будущего хода будет являться шириной текущей фигуры - 20 пунктов.
Таймфреймы М5 и М15 могут иметь больше ложных точек входа.
Сондай-ақ қараңыз
- Все
- Все
- Bearish Rectangle
- Bearish Symmetrical Triangle
- Bearish Symmetrical Triangle
- Bullish Rectangle
- Double Top
- Double Top
- Triple Bottom
- Triple Bottom
- Triple Top
- Triple Top
- Все
- Все
- Покупка
- Продажа
- Все
- 1
- 2
- 3
- 4
- 5
Triple Top
сформирован 23.04 в 02:30:18 (UTC+0)
сила сигнала 1 из 5

The Triple Top pattern has formed on the chart of the #Bitcoin M5. Features of the pattern: borders have an ascending angle; the lower line of the pattern
The M5 and M15 time frames may have more false entry points.
Открыть график инструмента в новом окне
Triple Top
сформирован 23.04 в 02:15:05 (UTC+0)
сила сигнала 1 из 5

On the chart of the AUDJPY M5 trading instrument, the Triple Top pattern that signals a trend change has formed. It is possible that after formation of the third peak
The M5 and M15 time frames may have more false entry points.
Открыть график инструмента в новом окне
Double Top
сформирован 23.04 в 02:15:05 (UTC+0)
сила сигнала 1 из 5
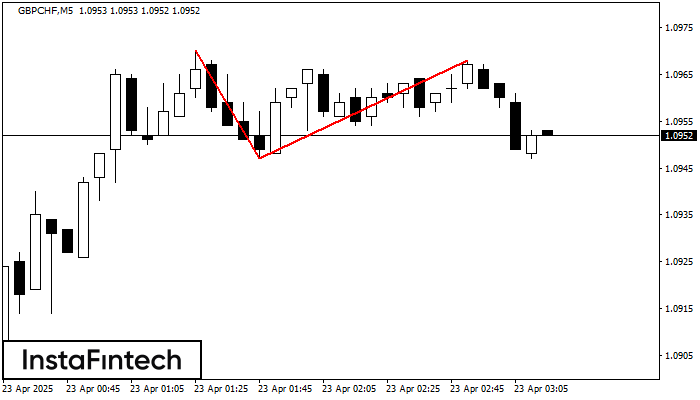
On the chart of GBPCHF M5 the Double Top reversal pattern has been formed. Characteristics: the upper boundary 1.0968; the lower boundary 1.0947; the width of the pattern 21 points
The M5 and M15 time frames may have more false entry points.
Открыть график инструмента в новом окне


